Continuing where we left off from having created a parameter that allowed us to drill down to breach type, let’s go into the parameter action today!
#4: Selecting a Breach Type
1. Now that we’ve figured the simple part out, let’s get complicated, first by figuring out why we want to get complicated! As you may have noticed, there’s some extra interactivity built into this chart:

- We have the buttons that allow for drilling down from overall breaches to breach type (this is the same functionality as we just set up in the earlier steps, just with a parameter action rather than with a parameter—buttons with parameter actions will be a future blog post)
- When the line chart just shows the overall number of breaches over time OR a specific breach type is selected after drilling down, that particular line is blue, while all the other lines are grayed out
- When you select a particular point, you can get information about the number of breaches, as well as the daily rate of breaches for that year, and this information is broken down by year and breach type; also, that particular point shows up as a visibly bigger dot to show what you just clicked on (selected point with a parameter action will be a future blog post)
- You can also get the same information for each point by hovering over it for the tooltip
I put all of these features into this chart because after building the previous version, I realized there was no way for the user to know what type of breach they were looking at after drilling down (while the solution/inclusion of all these features is a bit complicated, it all started with a simple reason). I could’ve added labels, simply by adding the same All Breaches or Type of Breach calculated field to Text on the Marks Card, but the lines are so close together that not all the labels would show (or would overlap):

I didn’t want to introduce different colors for each line because I didn’t want the colors to be overwhelming. Plus, I always wanted the user to be able to select a specific line to learn more about that breach type—how would the user be able to tell which line they had just selected if the line remained the same color throughout? It’s easiest to differentiate which line was just selected if that line turned the highlight color and the rest became gray, as the gray would be a visual cue for the user to know that those lines weren’t as important.
2. Let’s create a new parameter, this time for every type of breach as each of the values or “buttons” on the “TV remote.” This way, we can tell Tableau that when we pick a type of breach, only that particular breach should be colored in.
You can fill in all the values for the bottom half of the window manually, but you can also select a field on the right-side to have Tableau fill in all the values for you:
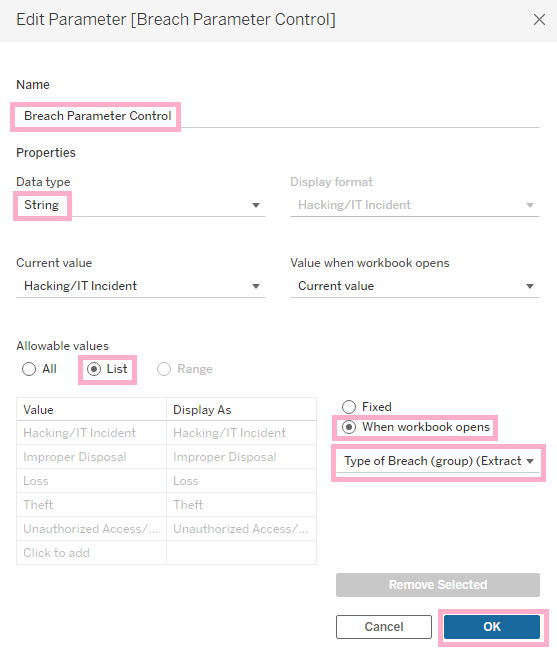
You can also choose whether to have this list of Allowable values be Fixed or retrieved from that particular field When workbook opens; the latter is dynamic, which is particularly useful if you expect your data to change. Note, however, that if you select When workbook opens, the Display As (i.e., the aliases) column is grayed out.
3. Right-click on the Breach Parameter Control parameter to show it.
4. Now, let’s build the connection between the parameter and the view. I created a calculated field called COLOR: All Breaches or Type of Breach, with “COLOR:” at the beginning of the name as a reminder that I’ll be putting this field on Color on the Marks Card.
I want two colors in this viz only, blue and gray, so I just want to assign two values to those colors… Now I just need to tell Tableau what to consider to be True and False (the two values) in a calculated field:

IF [All Breaches or Type of Breach Parameter] = ‘By Type’
AND
[Breach Parameter Control] = [Type of Breach (group)]
THEN TRUE
ELSEIF [All Breaches or Type of Breach Parameter] = ‘All’
THEN TRUE
ELSE FALSE
END
Originally, when I asked a colleague for assistance with this calculated field (never be afraid to ask for help, by the way!), he wrote it as a nested IF statement*, which I found a little difficult to understand, hence why I changed it into what you see above.
(* Note: For simplicity’s sake, I rewrote this particular calculated field, but a nested IF statement will be making its appearance in the next blog post, which will be about selecting a point on a line by way of parameter action.)
Let’s break down what this calculated field is doing:
Put it all together, and we’re giving Tableau the following instructions:
- If we’ve decided to break down the view by breach type (and thus multiple lines appear), AND we’ve decided to pick just one type of breach, only that one line out of all of them should be blue
- If we’re looking at all the breaches together, i.e., there’s just one line in the view, that line should be blue
- For everything else, which is the remaining condition, i.e., when we’ve drilled down and there are multiple lines in the view, all lines but one should be gray
5. Put this calculated field on Color on the Marks Card, and set the colors.
6. Time to test!

As you can see, when we don’t have any breakdown, when there’s just the one line visible, it’s blue. When we break down this line by breach type, only one line is colored in—one line out of all of them will always be colored in due to the nature of parameters, which is that parameters always hold a single value, unless you add in an extra option to gray all of the lines out. I’ve elected to not do that simply because I want to highlight Hacking/IT as the most common type as soon as the user breaks down the view. Finally, when selecting a different breach type from the Breach Parameter Control drop-down, only the corresponding line turns blue.
#5: Converting the Breach Parameter Control (i.e., the Type of Breach Parameter) to a Parameter Action
So far, in our testing, we’ve just been using the parameter to color in the corresponding line for the desired type of breach. In terms of user experience, it’s more intuitive to be able to select a particular line by clicking on it directly (it’s also visually less clunky to not have the dropdown show), so let’s create a parameter action instead. If we go back to the “TV remote” metaphor, parameter actions are like making your “TV screen,” or the view, a “touchscreen,” so that you can directly click a mark in the view to make something happen.
There’s a date parameter in this particular chart as well, for the dot on the line that the user clicks on, but that’s a future blog post; we’re just going to focus on making a parameter action on this worksheet for selecting the type of breach for now, which we’ll later convert into a dashboard action when it comes time to build the dashboard.
1. Go into Worksheet at the top, and select Actions… (or use the keyboard shortcut CTRL + SHIFT + A).

2. I like to select This sheet immediately when the window pops up; when you have a lot of actions in a workbook, it can be difficult to keep track. Then, select the type of Action you want to create, which in this case is Change Parameter…

3. Configure the parameter action. Give it a descriptive title, which in this case is Update Breach Parameter Control (I like to use the parameter’s name in the action, to make it obvious which parameter the action pertains to).
Source Sheets, which is the location of the action, at the moment is the current worksheet I’m on (Sheet 37—you should definitely be naming your sheets better, but I just made this sheet for the purposes of this blog post).
Run action on is where you tell Tableau what the user will be doing to prompt the action, which in this case is Select, as I want the user to click on a line.
Target Parameter will be the one that allows you to select a particular type of breach, which is the Breach Parameter Control.
Finally, Source Field is where Tableau is getting the information from in order to change the current value selected on the parameter, so it’s the calculated field containing the values matching the values in the parameter (the field is All Breaches or Type of Breach, which returns values from Type of Breach (group)—the field that matches the values in the Breach Parameter Control).
Here is the All Breaches or Type of Breach calculated field again, for easy reference, with the output being returned in that calculated field underlined:
IF [All Breaches or Type of Breach Parameter] = ‘By Type’
THEN [Type of Breach (group)]
END

What’s actually happening here? We’re telling Tableau that on this particular sheet, when a user clicks on a mark, something should happen. The thing that is going to happen is the update of the specified parameter with information from a specified field (each mark contains information from different fields; selecting the relevant Source Field is how Tableau knows what specific information to retrieve from that mark)—and again, the information from the mark matches a value on the parameter. Then, because that parameter is used in a calculated field, the calculated field will give us something else the value in the parameter—and finally, update the view.
What we can’t see happening because Tableau is doing all the work in the background:
a) While the Hacking/IT line is currently selected, the user clicks on another line (Theft).

b) Each mark contains information from different fields. When we configured the parameter action, we told Tableau to retrieve information from one field (highlighted below). When this mark was clicked, Tableau took the information from this field and this field only.

c) Selecting this field then updated our parameter from Hacking/IT to Theft. (Pay close attention to the Breach Parameter Control dropdown on the right.)

d) Now that the Breach Parameter Control’s current value of Hacking/IT has changed to Theft, the calculated field COLOR: All Breaches or Type of Breach has work to do, as it uses the Breach Parameter Control parameter in the calculated field.
Here it is below again, for reference:
IF [All Breaches or Type of Breach Parameter] = ‘By Type’
AND
[Breach Parameter Control] = [Type of Breach (group)]
THEN TRUE
ELSEIF [All Breaches or Type of Breach Parameter] = ‘All’
THEN TRUE
ELSE FALSE
END
If we return to our table, we can see that the condition this change in the Breach Parameter Control pertains to the first row of our table:
Now all the marks that match the current value of the Breach Parameter Control are assigned the value of True, which then finally means that the whole line pertaining to Theft turns blue.
If I were to represent this process graphically…

After creating the parameter action, it’s time to do some formatting, like removing the y-axis, as I intend to replace it with labels for a selected point and the tooltips. Next post will be about selecting a point on one of the lines with a parameter action, so stay tuned for that!