


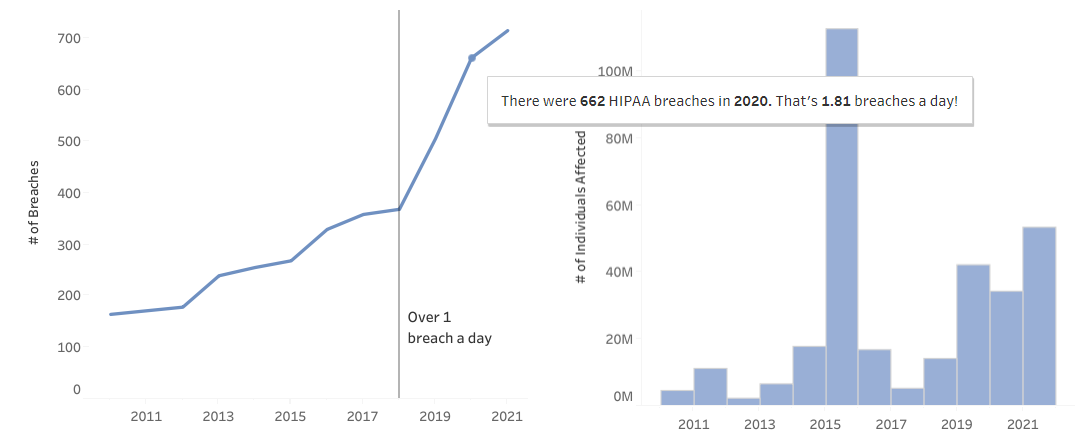
To wrap up the first section (other than making the buttons) of my HIPAA breaches dashboard remake, we’re going to talk about how you can select a point on a line with a parameter action, like so:

This line chart actually has a lone point dual axised with it. That point is what the user clicks on to access the information label associated with the point, which improves user experience by making it visibly clear what the user just clicked on. Let’s start by…
#1: Building the Static/Simple Visualization
Technically, because we’re building off the work discussed in the last two posts (drilling down with a parameter action), the visualization isn’t completely static, but the dual axising of the point will be (at the moment).
Let’s start by creating a calculated field. I’m just going to call it Static Point, to both remind me what it’s going to look like in the view and that this point won’t be changing.
This calculated field ended up being a little more complicated than I expected, as it involved a nested IF statement, due to the option of the drill-down:

IF [All Breaches or Type of Breach Parameter] = "All"
THEN
IF YEAR([Breach Submission Date]) = YEAR(#2020-01-01#)
THEN {FIXED YEAR([Breach Submission Date]):
COUNT([Name of Covered Entity])}
END
ELSEIF [All Breaches or Type of Breach Parameter] = "By Type"
THEN
IF YEAR([Breach Submission Date]) = YEAR(#2020-01-01#)
AND [COLOR: All Breaches or Type of Breach] = TRUE
THEN {FIXED YEAR([Breach Submission Date]) ,
[Type of Breach (group)]:
COUNT([Name of Covered Entity])}
END
END
In this case, the static value I’ll eventually switch out for the year parameter I’ll be creating later is #2020-01-01#, so the point I’ll eventually see in the view will be on the year 2020 (the # is just the syntax Tableau requires for dates).
If you’re also scratching your head over what this calculated field is doing, same here! That’s why I’m going to take a brief detour to break it down, piece by piece (but I’ll go much more into detail about nested IF statements with my next blog post!).
#2: Understanding Nested IF Statements
Nested IF statements have IF statements inside an overarching IF statement. While they’re useful for when you only want to use one calculation, they take a little longer to understand (and write). For some people, it’s useful to look at the IF statements that are inside first and then work your way out.
1. Let’s start with this section, which is inside the condition when the user selects “All” from the [All Breaches or Type of Breach Parameter] (i.e., to view the overall number of breaches over time) (in italics):
IF [All Breaches or Type of Breach Parameter] = "All"
THEN
IF YEAR([Breach Submission Date]) = YEAR(#2020-01-01#)
THEN {FIXED YEAR([Breach Submission Date]):
COUNT([Name of Covered Entity])}
END
In plain language, this says, if the year the breach occurred/was reported is the same as the example year we chose to put in (2020)—if we are looking at just that one line in the view—then give us the number of breaches for that one year, 2020 (i.e., that one dot). We have to “fix” the expression because COUNT() is an aggregation, and we can’t mix aggregates with non-aggregates (the non-aggregate part being the YEAR([Breach Submission Date]) = YEAR(#2020-01-01#) part).
Now, let’s move on to the ELSEIF, the other condition, which is what we want to happen when the user selects “By Type” from the [All Breaches or Type of Breach Parameter] (i.e., to view the number of breaches over time broken down by breach type).
As a reminder, this is what the COLOR: All Breaches or Type of Breach calculated field looks like, which colors just the one line (overall breaches over time) blue or colors in one of the lines in the breakdown/drill-down blue, each line representing one type of breach:
IF [All Breaches or Type of Breach Parameter] = ‘By Type’
AND
[Breach Parameter Control] = [Type of Breach (group)]
THEN TRUE
ELSEIF [All Breaches or Type of Breach Parameter] = ‘All’
THEN TRUE
ELSE FALSE
END
When we’re looking at the breakdown by type, if the year the breach occurred/was reported is the same as the example year we chose to put in (2020) and it’s the line we colored in blue for the drill-down by breach type, then give us the number of breaches just for that one year and specified type of breach (in italics). Again, we need a FIXED expression because we can’t combine aggregates and non-aggregates in a calculated field:
2. ELSEIF [All Breaches or Type of Breach Parameter] = "By Type"
THEN
IF YEAR([Breach Submission Date]) = YEAR(#2020-01-01#)
AND [COLOR: All Breaches or Type of Breach] = TRUE
THEN {FIXED YEAR([Breach Submission Date]),
[Type of Breach (group)]:
COUNT([Name of Covered Entity])}
END
Then, to keep them all in the same calculated field, we wrap the two conditions in an overarching IF statement—nesting them inside a bigger IF statement.
#3: Adding the Calculated Field to the View
1. Drag the Static Point calculated field to Rows.

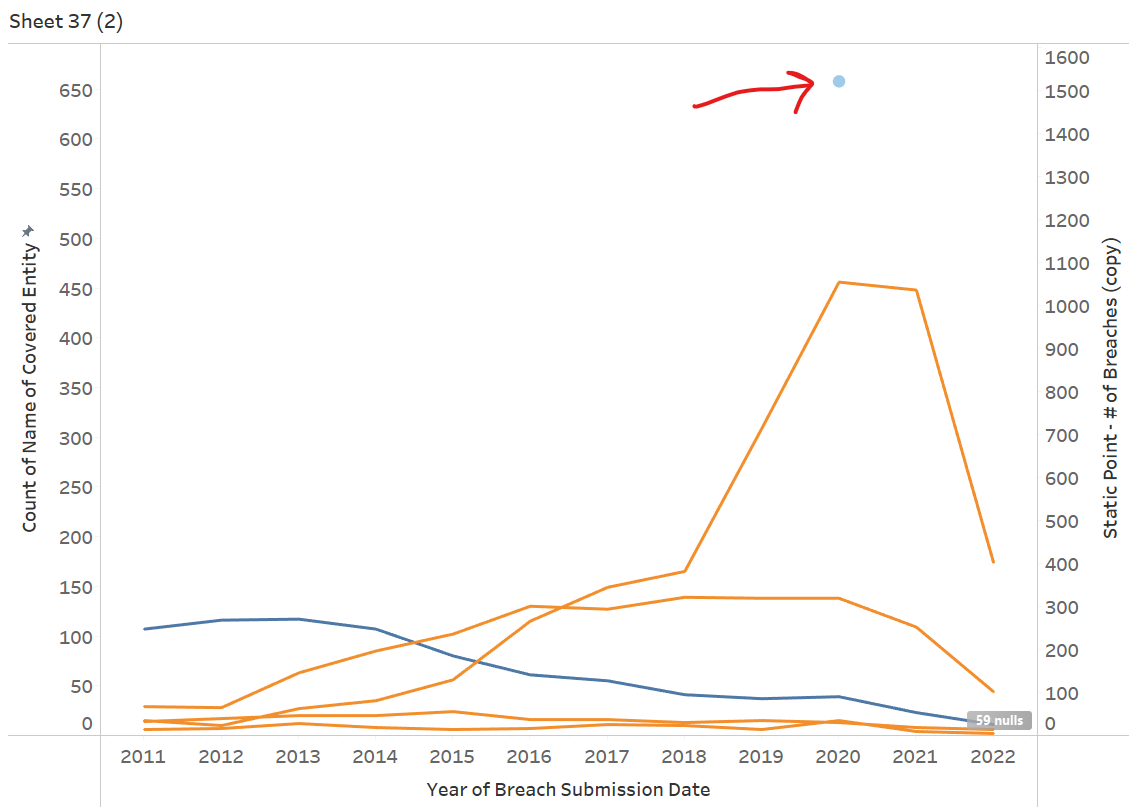
2. Right-click this field, and select Dual Axis. See the lone point? That’s our Static Point calculated field, but something’s starting to look off…
3. Oh right, in most cases, we need to synchronize the axes (right-click on the right axis and select Synchronize Axis, so that our lines and the point are on the same scale.

4. Where’d the point go?

Seriously, what just happened?
If you undo the axis synchronization and hover over the point’s tooltip, which I haven’t bothered to clean up yet (so that I can troubleshoot more easily like this), this is what you’ll see:

According to the tooltip, we can see that Tableau is saying the number of Theft breaches in 2020 is 1,521, but we know that’s incorrect, because when you hover over the Theft line, over the 2020 point, there were actually only 39 Theft-related breaches that year.
If you right-click on the point, then select View Data, then HIPAA Breaches (to view all the data for that mark, rather than just the Summary), we can see that we only have all the breaches for 2020, but the total count of all Theft breaches in 2020 shows up for every row—which is how LOD expressions work:

Each row actually represents just one breach, but because our FIXED LOD returned the total number of Theft breaches in 2020 for every row, and we dragged Static Point to Rows without changing the aggregation (it’s a measure, which Tableau aggregates by default), which was by default SUM(), Tableau actually summed up each of the rows. 39 * 39 = 1,521.
Thus, we can’t use SUM()—let’s use AVG() instead, which will give us the desired value in this case, 39.

5. Don’t forget to synchronize the axes again…

…and now the point appears perfectly on the line!
6. I’m also going to increase the Size of the point on the Marks Card, to make it more visible.
7. We’ve now seen the point be where it needs to be when the [All Breaches or Type of Breach Parameter] is set to “By Type”—let’s test if it looks okay when we set it to “All”:

Hooray, we’ve successfully made the static or “simple” version! Now, let’s bring in the parameter bit.
#4: Creating the Selected Year Parameter
We want to replace our static value of YEAR(#2020-01-01#), which returns the year of the data (i.e., just the value 2020), but I’m going to start configuring the Selected Year Parameter like below:

Note that the list of values is all the date data type. We’re going to wrap the YEAR() function around the Selected Year Parameter values in order to give us just the four-digit year value. As we’re checking whether the Selected Year Parameter matches the year of the Breach Submission Date (i.e., when the breach was reported), we’re going to wrap YEAR() around that field as well, to ensure that we’re comparing apples to apples.
#5: Adding the Selected Year Parameter to the Calculated Field
Let’s duplicate our calculated field with the static value, to preserve our original work, in case we need to go back to it. Then, replace the static value #2020-01-01# with the Selected Year Parameter, and rename it (I named it Selected Point – # of Breaches):

IF [All Breaches or Type of Breach Parameter] = "All"
THEN
IF YEAR([Breach Submission Date]) = YEAR([Parameters].[Selected Year])
THEN {FIXED YEAR([Breach Submission Date]) :
COUNT([Name of Covered Entity])}
END
ELSEIF [All Breaches or Type of Breach Parameter] = "By Type"
THEN
IF YEAR([Breach Submission Date]) = YEAR([Parameters].[Selected Year])
AND [COLOR: All Breaches or Type of Breach] = TRUE
THEN {FIXED YEAR([Breach Submission Date]),
[Type of Breach (group)] :
COUNT([Name of Covered Entity])}
END
END

#6: Bringing the New Calculated Field (with the Parameter) into the View
1. Let’s duplicate our view and replace the Static Point calculated field with our new one (don’t forget to 1) take the AVG(), not the SUM(), 2) change the new point’s Size on the Marks Card as well, and 3) Right-click on the Selected Year Parameter to show it):

Luckily, Tableau preserved our Dual Axis and Synchronize Axis selections from earlier, so we didn’t have to do those again.
2. Time to test!

#7: Converting the Parameter to a Parameter Action
1. Now that our Selected Year Parameter works, we can convert it into a parameter action! We’re going to try it on the worksheet first, before we put it on the dashboard, so go to Worksheet at the top, then Actions…, then Change Parameter…
2. Configure the parameter action:

This configuration tells Tableau that the name of the action is to update the Selected Year Parameter, for this specific worksheet. The action will be triggered by a user selecting a mark, which will then update the Selected Year Parameter with information from that mark, and the specific information from that mark (i.e., the Source Field) will come from YEAR(Breach Submission Date). After the information from the Source Field updates the current value in the parameter, the calculated field(s) using that parameter will update based on that new value.
3. Test it out:

See how when I click on different marks in the view, the associated parameters for breach type and the year change with it? That’s how we can tell the parameter actions are working as intended.
#8: Creating the Labels
To make the user experience smoother, I want to also provide some information when the user hovers over points on the lines (tooltips) and when the user clicks on a point, which will display information only for that specific point (same formatting for the tooltips and labels, in this case). To figure out what information I wanted to include and how to format it, I hovered over one of the default tooltips to list out the values and what fields they were from to plan out both the formatting and the logical expressions I’d need to write (this was also helped by the fact that I'd already had some information from my original version of this dashboard).
I wanted it to be clear what the user had clicked on, so the label had to include whether they were viewing the overall number of breaches over time or by breach type, what type of breach for the latter, the year of the point that they’d just clicked on, etc. But I didn’t just start writing calculated fields for the labels cold—I planned those out by first using example values… kind of like how I started out with a simple/static visualization before bringing in the parameters to make it more dynamic, which then helped me figure out the calculated fields I needed to create, as well as which ones I could reuse from when I’d first made them for the viz. The most important thing I learned from writing them all was to go one step at a time, building each calculation with a table in front of me to see how each component of the calculation reacted to each other based on the logic I wrote.
Anyway, that’s how I created the first section of my HIPAA breaches dashboard remake! Next time, I’ll go into more detail about nested IF statements, like the one featured in this blog post!