As previously mentioned, I remade my HIPAA breaches dashboard as a way to practice implementing interactivity and to also get more comfortable with parameters and parameter actions, so the next few posts will cover how I used parameters and parameter actions to build the visualizations and end with how I created buttons as the final piece. Today, I’ll be covering the first part of how I made this drill-down, which allows you to view the number of HIPAA breaches over time altogether or by the type of breach:
It’s a bit daunting to come back to this visualization now and document the process, as some time has passed since I last looked at it closely, and if I’m being honest, it was a bit daunting at the time as well, to actually build it. I’d been watching Andy Kriebel’s tutorials, especially this one, to understand how to implement drill-down functionality, but I quickly realized I needed to do something else in order to make mine work.
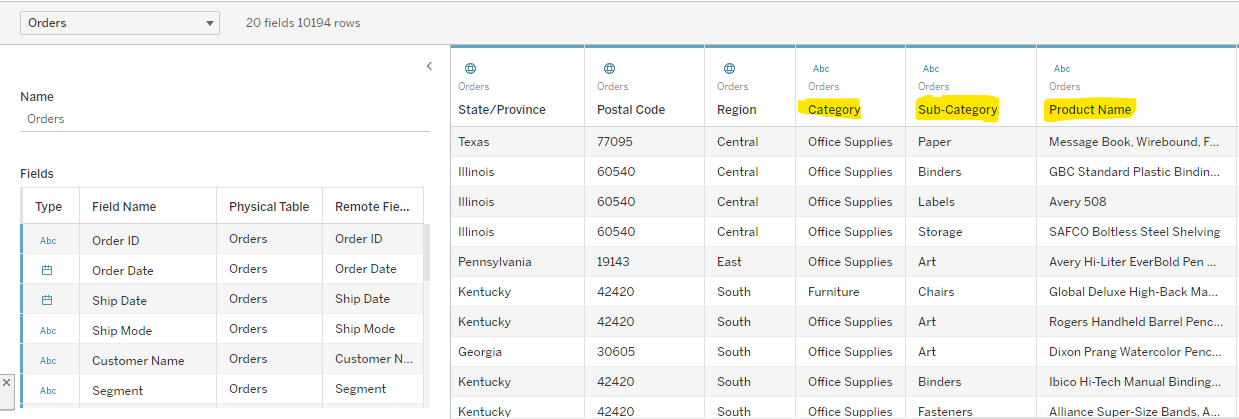
Andy Kriebel’s example sort of but not really uses Superstore’s Product Hierarchy for the drill-down, which looks like this (“sort of but not really” meaning he’s not using Tableau’s built-in hierarchy function for this, but the fields for the hierarchy do exist).
In Tableau, Superstore’s fields look like this:
In my head, I think of it like this:

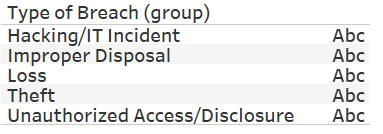
However, in my case, I don’t have this hierarchy. I have the Type of Breach field, but that’s about it:

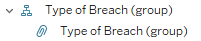
Because I only have that one field that will allow me to do the breakdown, Type of Breach (group)*, I really just have this as my “hierarchy”:
(* Note: I created a group rather than use the original field because there were some breaches that were listed as being multiple types at once, which I grouped all under ‘Combination’—they seem to have stopped recording breaches as being more than one type since then, as there are only a handful, which I excluded from the analysis.)
I can right-click on the field to create a hierarchy, but as I only have that one column in this hierarchy, it doesn’t yield anything useful (nor can I make the drill-down using the linked tutorial, at least not without making some modifications):
Visually, ideally, my hierarchy would look like this:

The only problem is that the field indicating (all breaches), or the “Category” equivalent from Superstore isn’t in the data. I could have simply added a new field to the data that just said “All Breaches” for every row, but I wanted to see if it was possible to do it a different way. So what can we do?
Let’s go from the top, starting with…
#1: Building the Static/Simple Visualization
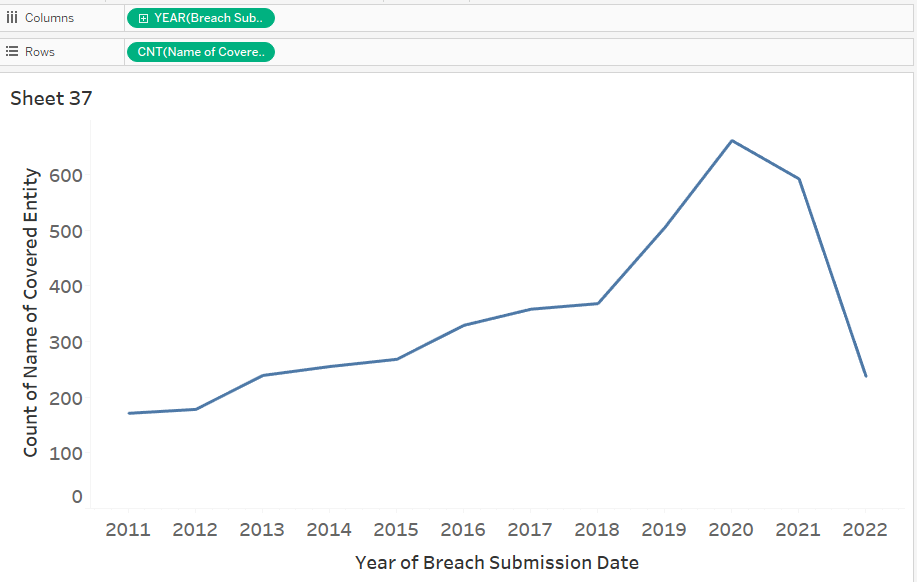
1. As always, I like to start simple, then get complicated, so the most basic version of this chart is a line chart to show the number of breaches over time, with YEAR(Breach Submission Date) on Columns and CNT(Name of Covered Entity)* on Rows.
(* Note: The count of the Name of Covered Entity field is how I’m counting the number of breaches.)
Since I want it to be broken down by Type of Breach eventually, I’ll build a second sheet showing that, so that I can check my work. The only real difference between the first sheet and this sheet is that I’ve added Type of Breach (group) to detail to break up the view:

2. Note also that I’ve fixed the axis for the Count of Name of Covered Entity. This is because when I’m eventually able to get this visualization working, the user won’t be misled into thinking that the number of breaches when broken down by type is as much as when all the breaches are visualized altogether, which wouldn’t make sense. Compare to if the axis isn’t fixed:
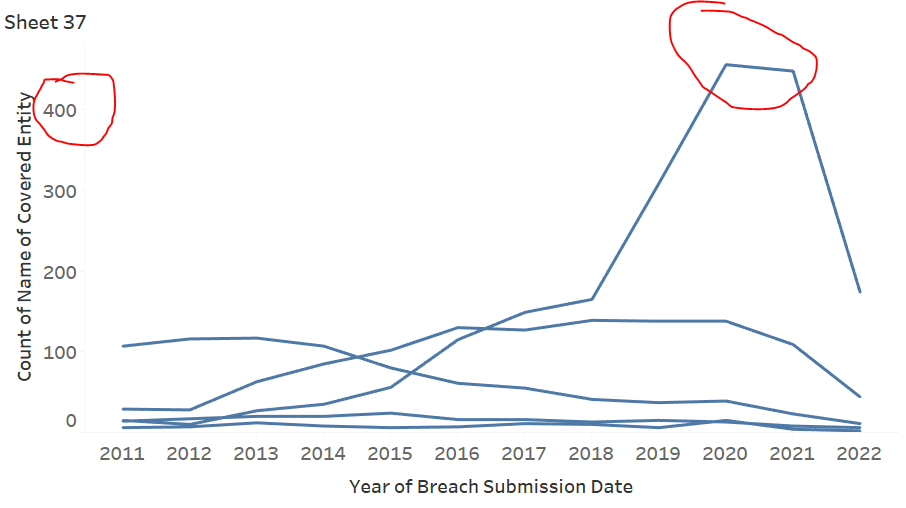
Without the axis being fixed, it looks like the number of breaches that were the Hacking type is the same as the overall number of breaches in 2020; the user has no way to accurately gauge the magnitude without a static axis for reference.
#2: Creating the Parameter
1. I’ve written about how I came to understand parameters before (with a parametaphor); let’s create our remote control and the buttons on it, starting with a descriptive title. The two “buttons” (Allowable values) I want on my “remote control” (parameter) are the words “All” and “By Type,” which is why String is the data type:

2. Then, right-click on the parameter to show it on the right-hand side of the worksheet.
#3: Creating the Calculated Field to Connect the Parameter to the View
1. Nothing happens when we select an option on the parameter because we haven’t told Tableau how the parameter and the view are connected yet. We need to create a calculated field that tells Tableau exactly what needs to happen when we select a particular option on the parameter’s drop-down (i.e., when we press a “button” on the “TV remote”).
As previously mentioned, the only difference between our line charts showing the overall number of breaches over time and the number of breaches over time by breach type is this additional pill here:
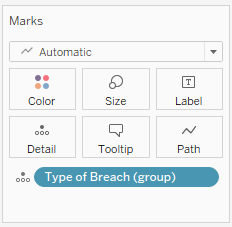
Thus, this pill needs to somehow disappear when we select the corresponding parameter value (“All”).
Let’s create a calculated field, called All Breaches or Type of Breach:
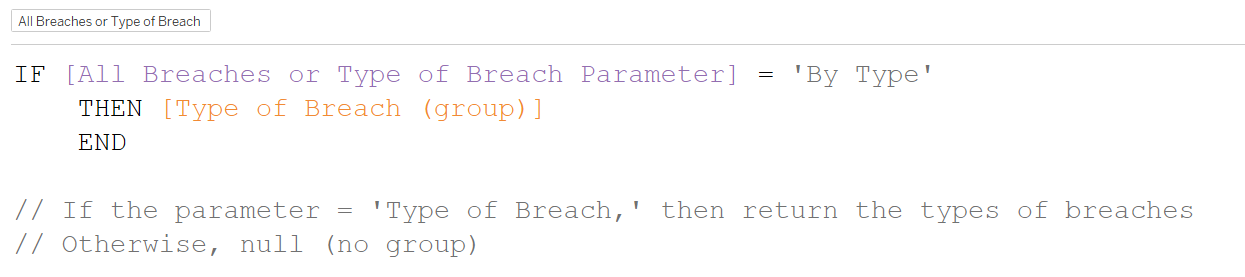
IF [All Breaches or Type of Breach Parameter] = ‘By Type’
THEN [Type of Breach (group)]
END
What is this IF statement saying? It’s saying if we select the value “By Type” from the parameter, then make this field [Type of Breach (group)] appear in the view. Because we do have another value “All,” this statement implicitly also says, when the user selects the “All” value (i.e., anything that isn’t “By Type”), then show nothing, disappear—make the value null. And even though the value is null, technically, that itself is the larger overarching group that all the breach types have in common.
Put in other words, because all the breach types belong to a null group or no overarching group at all, that null group is a group in and of itself; because that group is nothing, that group contains everything.
Trippy, right? It took me a moment to wrap my head around it, too.
2. Now, let’s put it on Detail on the Marks Card.
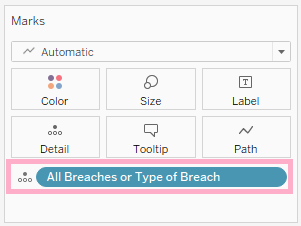
3. Now, let’s test it out (after fixing the Count of Name of Covered Entity axis, of course)!

See how the All Breaches or Type of Breach calculated field stays on Detail, even as we switch between breaking up the view by breach type and seeing them all aggregated together? That’s the calculated field’s implicit ELSE that we didn’t write into the field itself doing the work of rendering the dimension pill on Detail null.
That’s it for this time! Next post will continue with creating a parameter action!