


What is cardinality in Power BI?
Cardinality in Power BI describes how two tables relate to each other in a data model view; it shows where the data moves to and from in the relationship. Let's walk through what this looks like.
If you go to your model view:
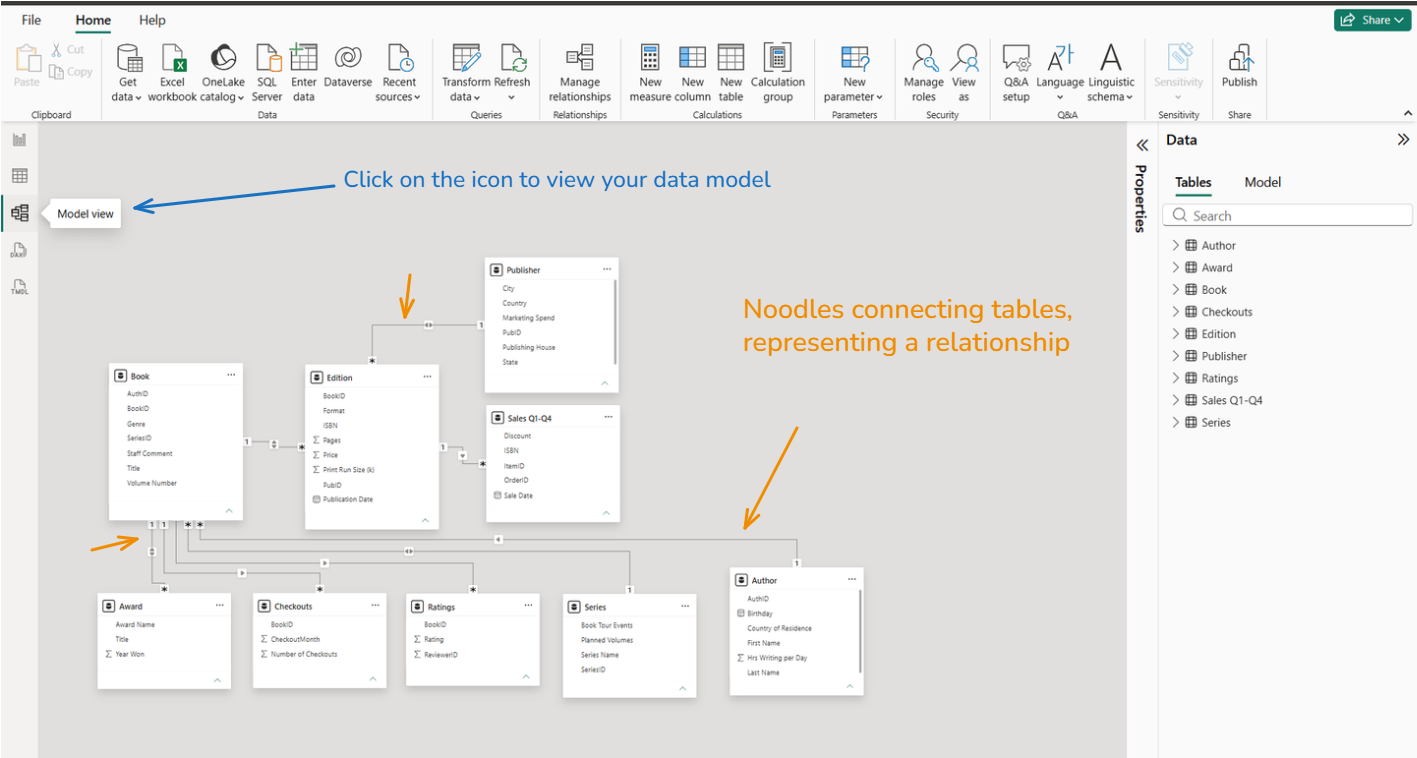
You can check the cardinality of your relationship by right-clicking on the noodle (the line connecting the tables) and then clicking on properties. After, you'll see an interface similar to this:
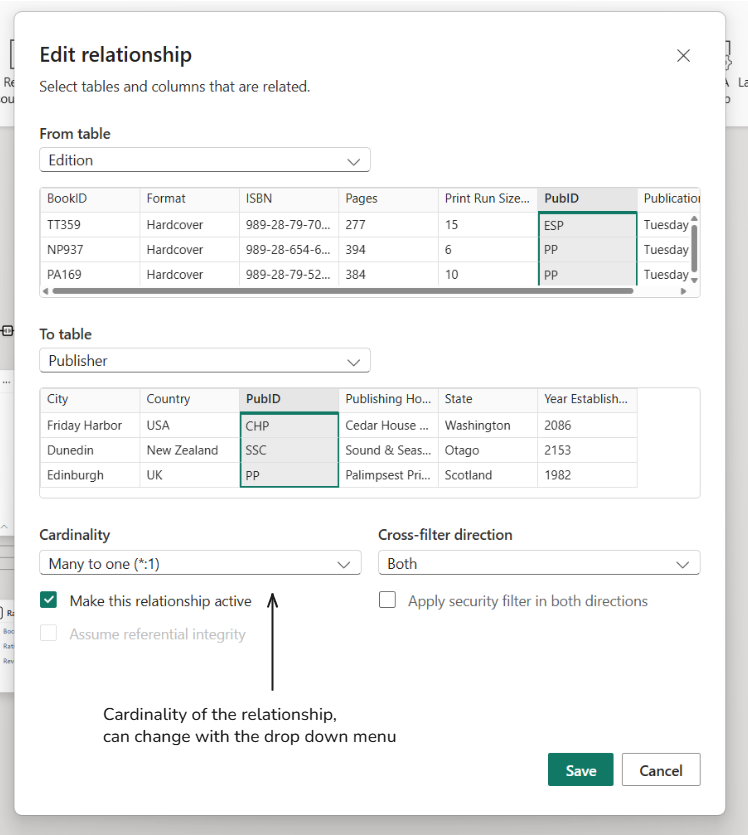
This is how to change the relationship of your tables, and one way to understand what the relationship is. You can also see what the "key" connecting the two is– here the key is PubID, an unique value in both tables.
Cardinality Types and Symbols
One-to-many and many-to-one relationships
A one-to-many relationship means that, while the key connecting the two tables may be unique in the first table, it appears many times in the second table. The one is symbolized by "1", and the many is represented by the "*" symbol (see below).
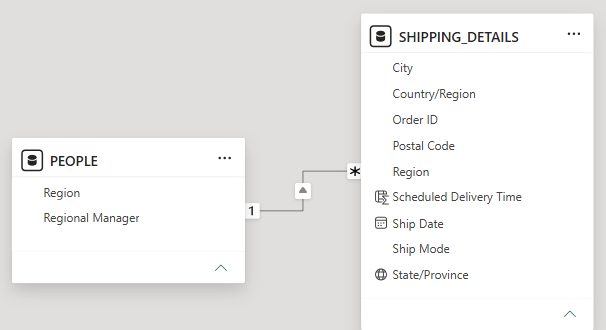
In this example, the people table is connected to the shipping details table by region. This one-to-many relationship means that, while the region only appears once in people—let's say North—multiple shipping orders could be for that region, so North repeats. Many-to-one is essentially the same thing but in a different order, so having shipping details first (*) and then people (1).
One-to-one relationship
A one-to-one means that, for each of the selected value in Table A, there's one of that value in Table B. This is denoted by the "1" symbol near both tables in the data model (see below).
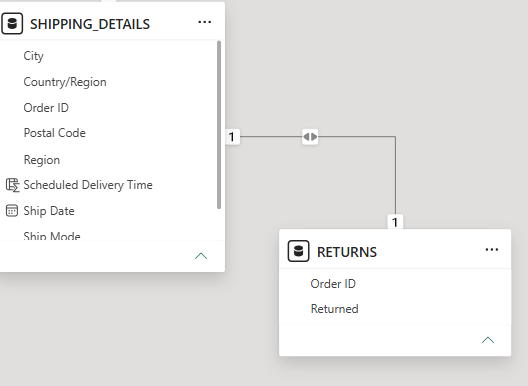
In this example, the key is Order ID. So, each return has a Order ID, and in the shipping details, that same non-repeating Order ID is also present.
You may also find that some tables use a unique identifier to connect the two on a one-to-one level, usually a combination of two fields that are in both tables.
Many-to-many relationships
A many-to-many relationship means that the selected key repeats in both of the connected tables, symbolized by two *. This cardinality type of less common.
Conclusion
How data is connected can have an affect on how charts are built out. It's good to be familiar with cardinality and the related symbols to ensure that your model view is correct and you can access the necessary data between tables, or do additional calculations later on.