


In this blog I'll be going through my process of building a data pipeline in Snowflake using DQL, DDL, and DML.
The first step of this project was exploring the data; understanding the granularity, what each field meant, and then building a schema. Then I inputted the data into Snowflake, combined two datasets, and broke up that dataset into smaller tables to optimize the analysis process. Then, I connected the tables to Tableau where I built out the logical connections before uploading data sources to server.
About the Data
For this project, I used two datasets about the NYC Housing Connect, which is a lottery system for connecting New Yorkers with affordable housing opportunities. The two datasets were:
- Advertised Lotteries on Housing Connect by Lottery
- Each row a lottery ID
- 1,754 rows and 30 columns
- Advertised Lotteries on Housing Connect By Building
- Each row a housing connect building ID and a lottery ID
- 2,150 rows and 30 columns
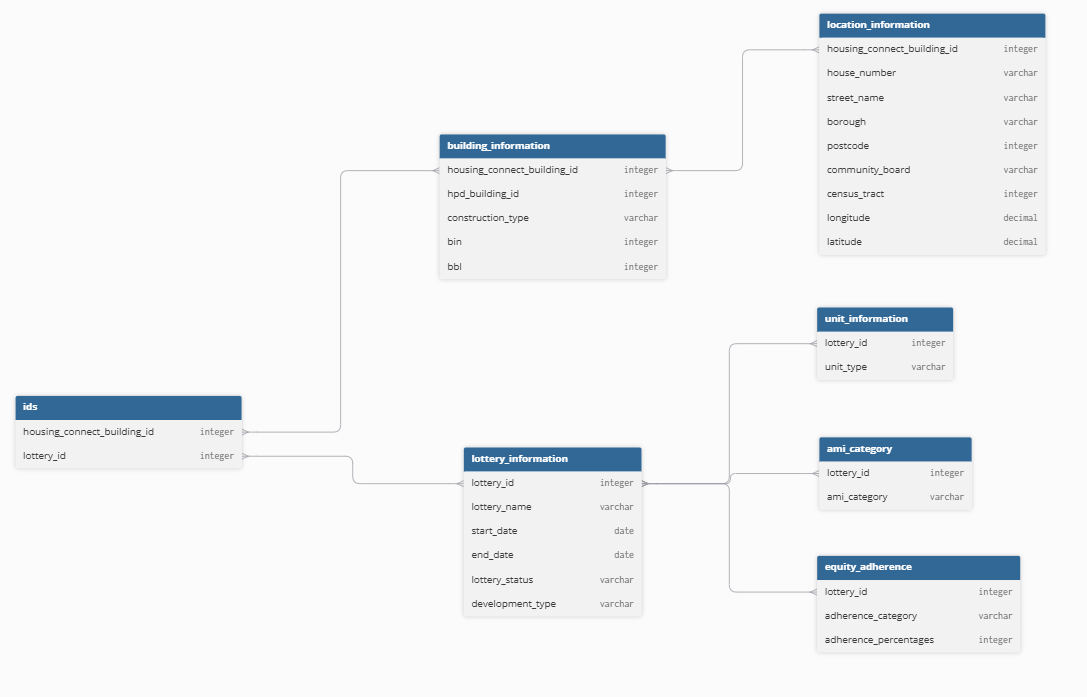
The two user stories I constructed for the data are a Housing Connect Manager, who aims to serve the NYC community by looking to understand building progress and unit availability by comparing development type, construction type, and available unit types, and a Fair Housing Analyst who needs to figure out how equitable the available units are by finding out how many units are available for different income levels and reserved groups by comparing relevant values by lottery. For this purpose, I built the schema below.
Combing the Datasets
To combine the datasets, I uploaded the .csv files to Snowflake. Then, after first checking using DQL with the following:
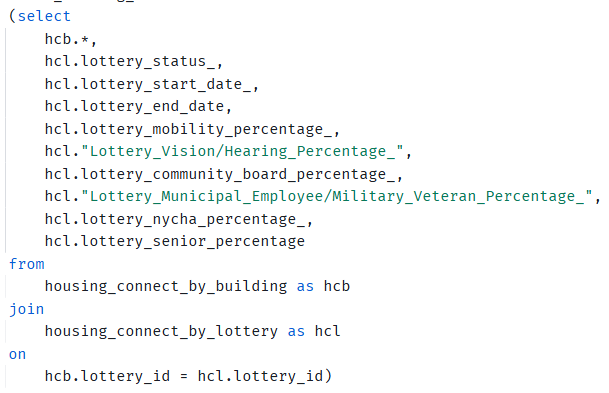
I turned this query into a DDL statement by inserting it into a 'create table' command.
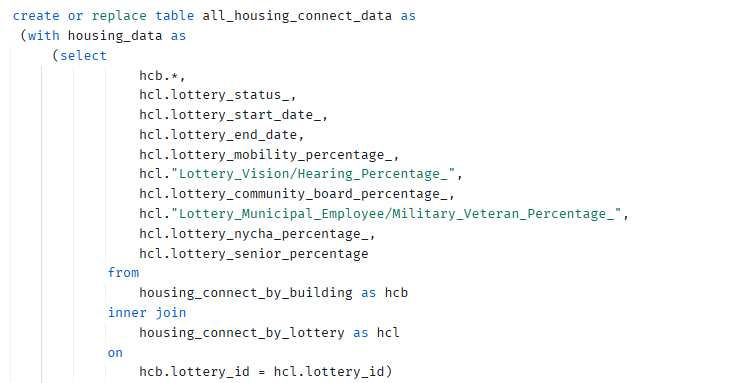
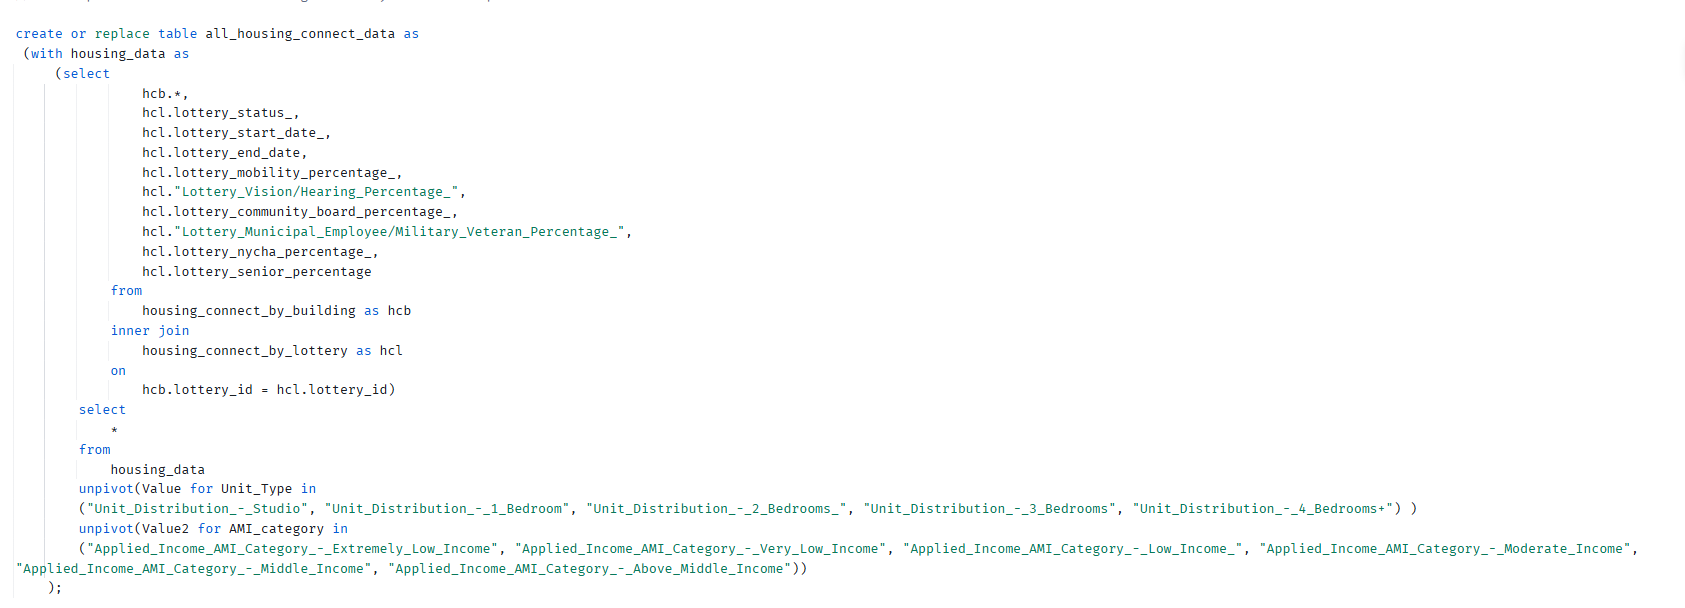
Next, I actually had to unpivot the data, as current the category fields I want for my schema (i.e., unit type) had each category as a header, and then counts of that category as values, leading to a lot of nulls. To optimize storage and the analytical process, I dropped the counts and unpivot the columns.
It was at this point that I encountered a restraint, leading me to only unpivoting for Unit Type and AMI Category (Area Median Income), and making the Equity Adherence table out of scope for the timeline of the project.
Below is the unpivot syntax, where I essentially added the text to the end of the join within the DDL.
Creating Dimension Tables
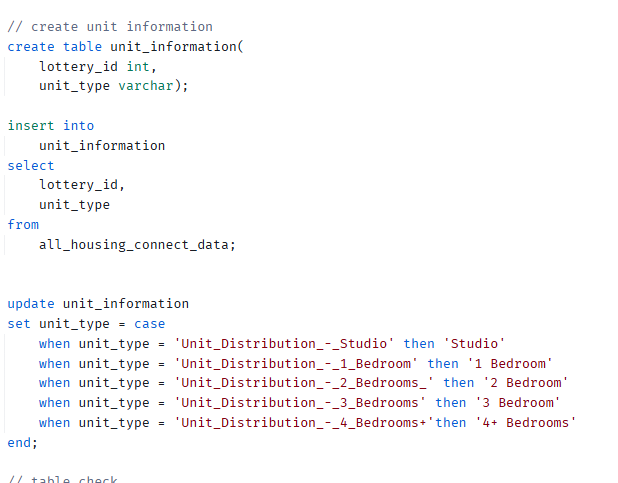
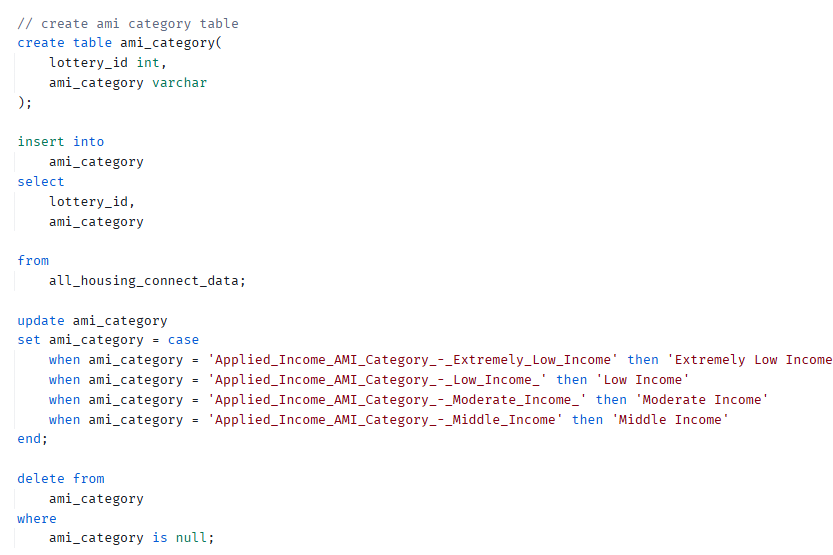
Next was a series of DDL and DML commands where I would first create the table and then inset the values. For two of the tables, Unit Information and AMI Category, I also used a CASE statement in order to clean up the values.
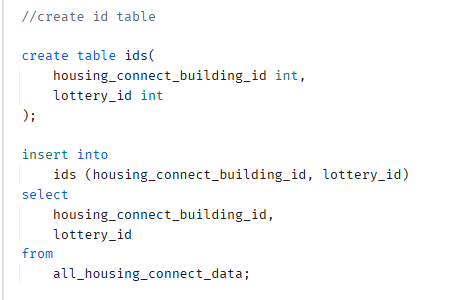
The ID table has Housing Connect Building ID and Lottery ID from the combined dataset.
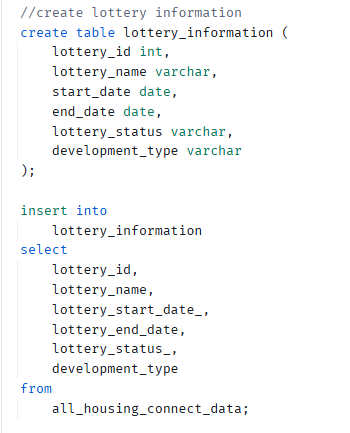
Next, Lottery Information has details about each Housing Lottery with Lottery ID as the unique value.
Unit Information then connects to the Lottery Information table, having the list of unit types.
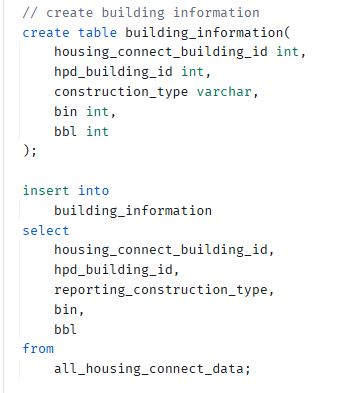
Connect to the ID table is building information, where each row is a Housing Connect Building ID.
Connecting to Building Information is Location Information
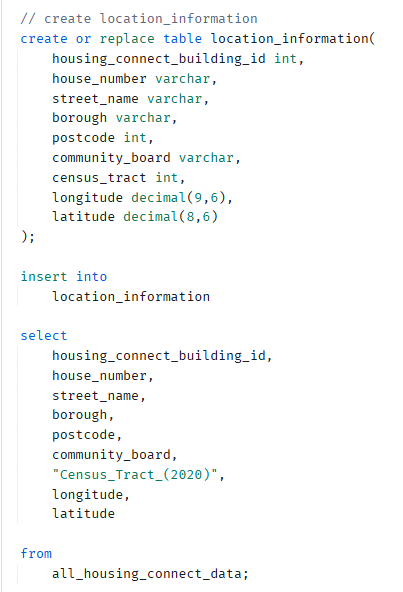
Location Information then connects to the AMI Category table.
Connecting to Tableau
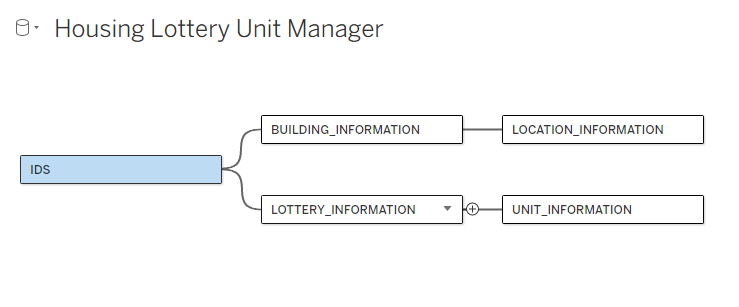
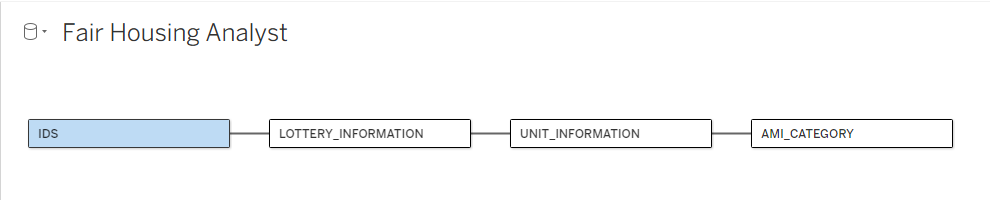
By using Open Database Connectivity I connected the tables to Tableau and built the following logical tables for the users.
The first one allows the manager to access building information and lottery information, and the second one allows the fair housing analyst to access only the necessary lottery, unit, and income information needed to determine how units are being allocated fairly.
Reflection + Next Steps
In the future I should add constraints during the table building process, such as defining which fields are the primary keys and which ones should not have null values. This will allow for greater data integrity and decrease the likelihood of possible future issues.
Additionally, the issue with the Equity Adherence table occurred when trying to nest three unpivot statements, so I plan on troubleshooting that issue to understand why it didn't work.
Overall, this project taught me the importance of building a good schema as a schema has to be built well to allow for appropriate and relevant analysis.