


Static dashboards capture a snapshot, but when you want an audience to feel how a metric evolves across months or years, animation can turn numbers into a narrative.
In Tableau, the Pages shelf is the tool designed specifically for this. It divides a view into separate "pages" based on a dimension or discrete date, allowing you to flip through steps manually or press Play to watch your marks move across time.
Here is a step-by-step guide on how to build a dynamic, time-lapse chart using the Pages shelf, along with key settings to make your animation look polished.
1. Set Up Your Base Chart
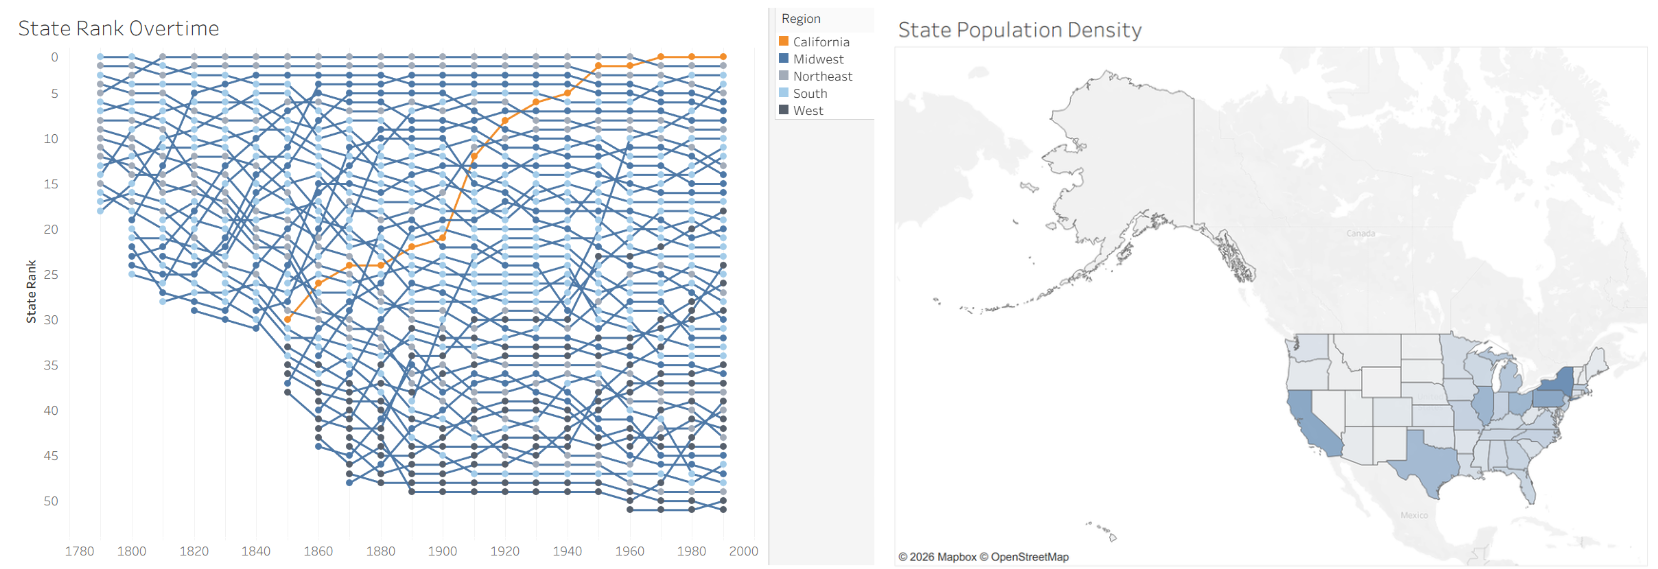
Before touching the Pages shelf, you will need to build the chart you want. For this I have created two charts (using US Census data from a MoM 2026 week 42).
2. Add Your Date Field to the Pages Shelf
Drag your date field (for me I just have year but if you are using superstore or equivalent you could use order date for example) directly onto the Pages shelf (located above the Filters shelf). Right-click the date field on the Pages shelf to choose the appropriate date granularity.
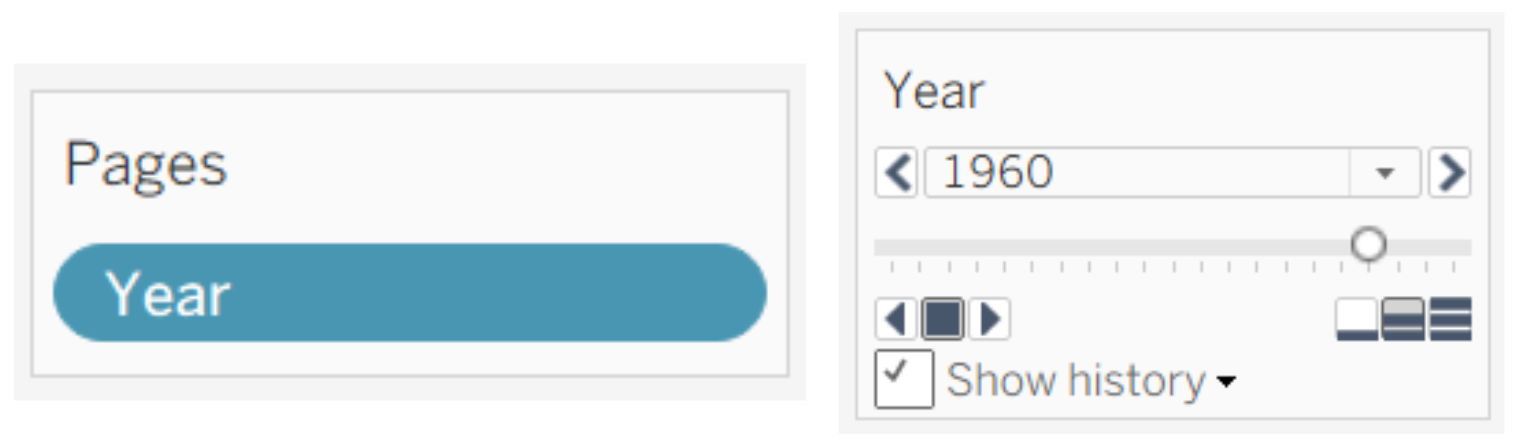
As soon as the date is dropped onto the shelf, Tableau reveals the Page Control floating card on the right-hand side of your canvas.
3. Configure the Page Control Controls
The Page Control card acts like a media player. Familiarize yourself with the playback options:
- Slider / Dropdown: Jump directly to any specific date in your dataset.
- Play / Step Controls: Step backward, pause, or play forward.
- Speed Setting: Three notched bars let you choose Slow, Medium, or Fast playback speeds.
- Page Loop: The loop icon allows playback to cycle continuously through the time range.
4. Enable "Show History" for Cumulative Tracking
Watching dots jump around on a blank canvas can make it hard to see the broader trend. The Show History feature leaves a visual trail of past data points.
- On the Page Control card, check the Show History box.
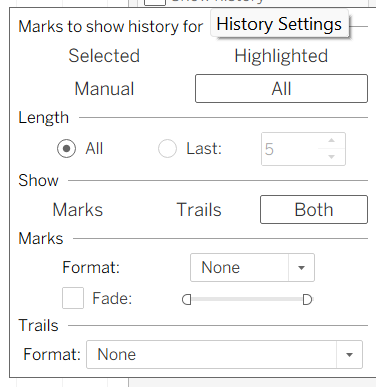
- Click the small drop-down arrow next to Show History to open the configuration menu:
- Marks to Show History For: Select All to show trails for all items
5. Polish with Dynamic Page Titles
To ensure your readers always know which year or month they are viewing during playback:
- Double-click the Sheet Title.
- In the Edit Title dialog box, click Insert in the top-right corner.
- Select
<Page Name>or<Page Number>. - Format the text (e.g.,
"Global Performance: <Page Name>"). As the animation plays, the title updates in real-time.
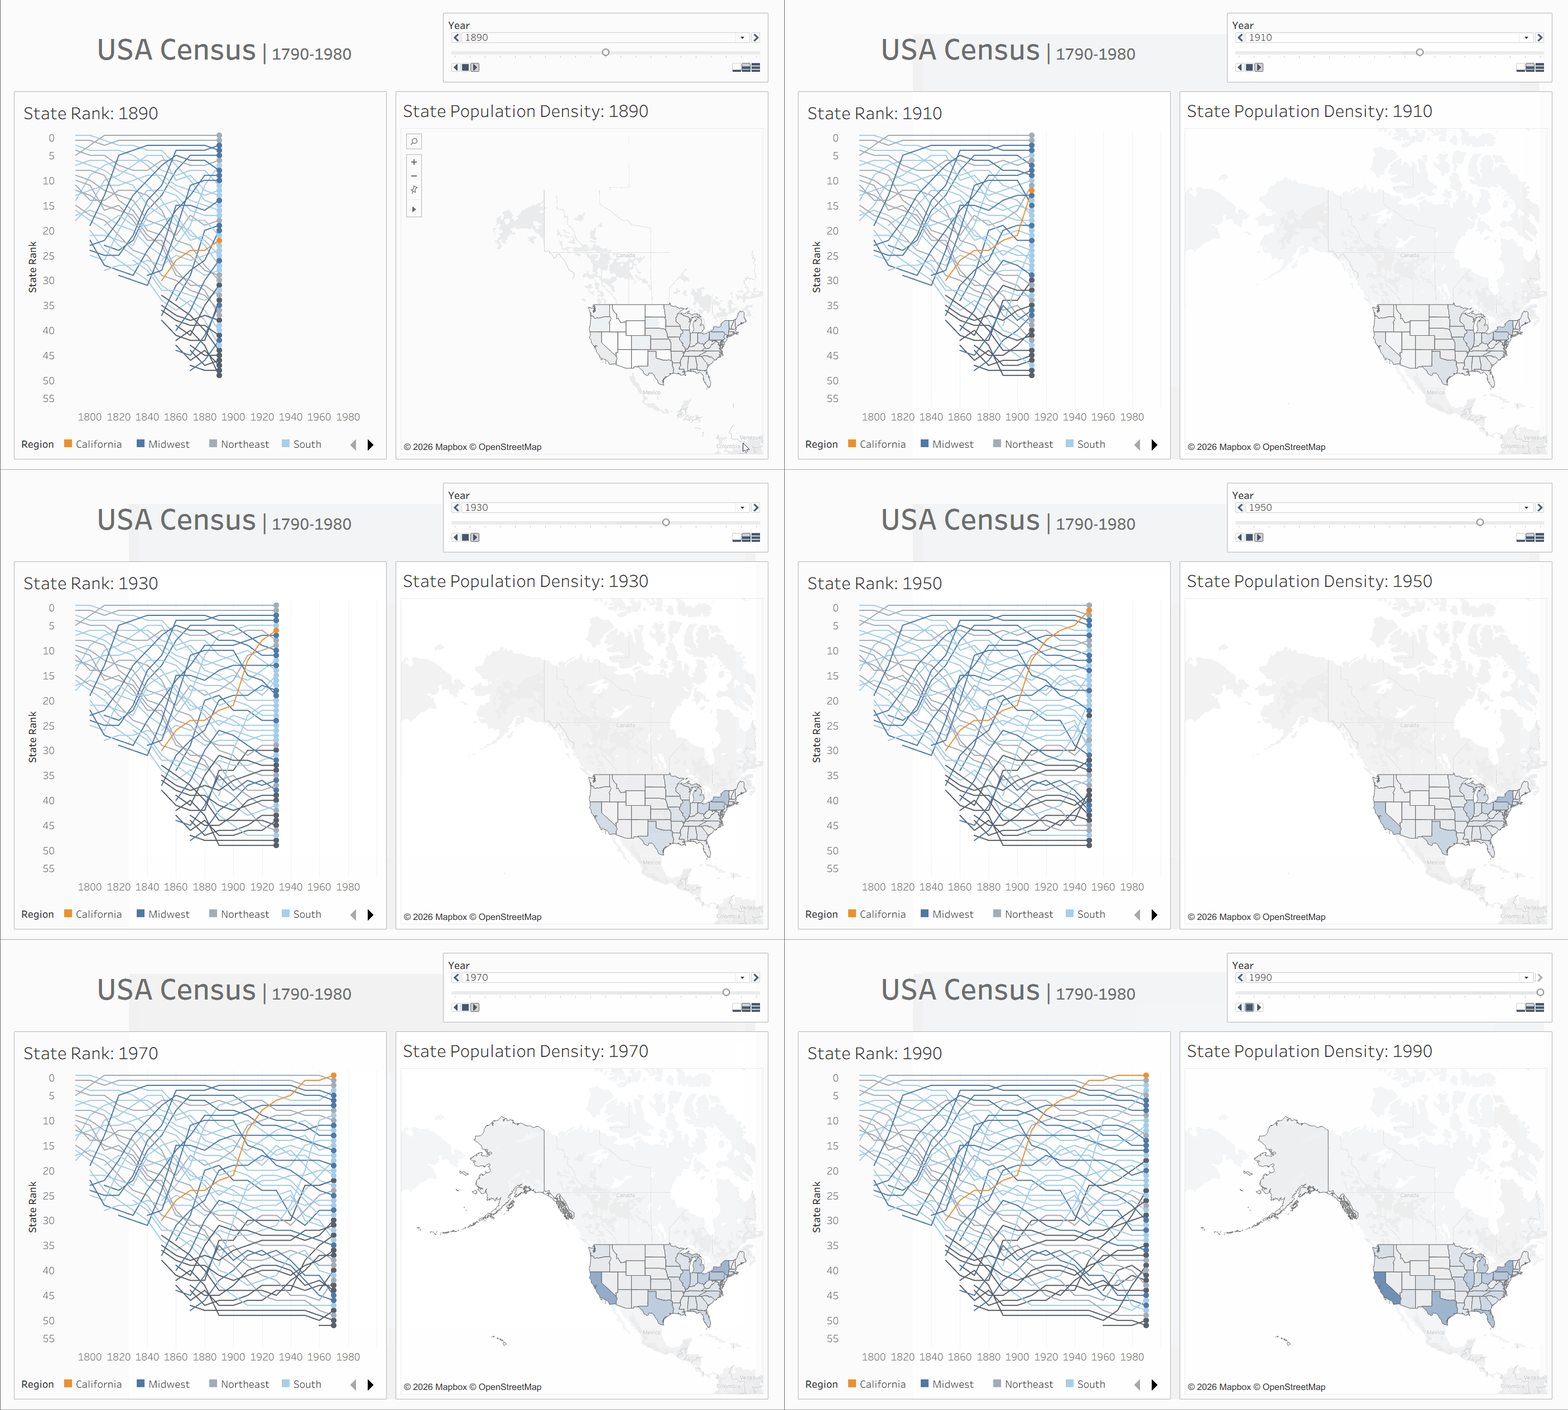
Overall, the Pages shelf is an intuitive way to explore temporal patterns in Tableau Desktop without bloating your dashboard with dozens of separate visual snapshots.