Today was our first proper session working with DAX (Data Analysis eXpressions) in Power BI. We focused on building confidence with the basics - working through text, date, logical, and maths functions to get a feel for how DAX can help us shape and understand data. Here’s a quick summary of what we tackled and what stood out.
Text Functions
We started with simple text transformations, focusing on creating clean, standardized outputs. Here are some examples.
1. Concatenating 2 Fields
We combined first and last names into one column using:
Full Name = Customer_Purchases_Table[First Name] & " " & Customer_Purchases_Table[Last Name]
2. Return the First Name Initial
The LEFT function gives us whatever comes at the start of the string, and we choose how many characters we want:
First Name Initial = LEFT(Customer_Purchases_Table[First Name], 1)
3. Construct standard email addresses
We formatted these to be lowercase and consistent, in the form orussell@thelab.co.uk:
Email = LOWER(LEFT([First Name],1) & [Last Name] & "@thelab.co.uk")
4. Replace first names in bulk
To change all instances of a name, in this case changing all Louis's to Ted:SUBSTITUTE([First Name], "Louis", "Ted")
Text functions like these are essential for cleaning customer data and building standard formats.
Date and Time Functions
Next, we used date-related functions to better understand customer activity over time.
1. Weekday number with Monday as 1
Here we need to choose 2 as the [ReturnType], as Power BI auto-formats to having Sunday as the first day of the week:Day of Week = WEEKDAY(Date_Lookup[Date], 2)
2. Extract the joining month from a date
This converts dates to just a number for the month from 1-12, this can be done 2 ways:Member Joining Month = Customer_Purchases_Table[Member Joining Date].[Month]
Member Joining Month = MONTH(Customer_Purchases_Table[Member Joining Date])
3. Calculate how long someone has been a member based on today’s date:
The DATEDIFF function calulates the difference between 2 dates, in the increment chosen.Days Since Joining = DATEDIFF(Customer_Purchases_Table[Member Joining Date], TODAY(), DAY)
Logical Functions
We also explored how DAX can be used to group data based on conditions.
1. Categorise product prices into "Low", "Medium", and "High" tiers:
Here we used an IF statement inside another IF statement.Product Price Type = IF([Price] < 10, "Low", IF([Price] < 30, "Medium", "High"))
2. Using && to create multiple clauses in an IF statement
You can alsouse the function AND similarly:Deal Type = IF(LEFT([First Name],1) = "J" && [Days Since Joining] > 100, "Special Deal", "Standard Deal")
These kinds of classifications are useful for targeting and segregating different classes in the dataset.
Mathematical Functions
Finally we introduced some basic maths functions, most of which can be selected when dragging and dropping, but creating separate calculations is useful if these fields are required more than once.
1. Average customer spendAverage Purchase Amount = AVERAGE(Customer_Purchases_Table[Total Purchases])
2. Appling a 10% discount to PricesDiscount Price = Product_Table[Price] * 0.9
3. Count of unique products per customerNumber of Products = DISTINCTCOUNT(Product_Table[Product ID])
4. Calculate revenue using related data
We had price stored in a separate table, so we had to introduce the RELATED function:Revenue = Sales_Table[Quantity] * RELATED(Product_Table[Price])
Even in a single day, we saw how powerful DAX can be. With just a few functions, we were able to clean data, extract insights, and prepare for real analysis tasks. These basics will help us start advanced modelling and reporting as we continue to build our Power BI skills.
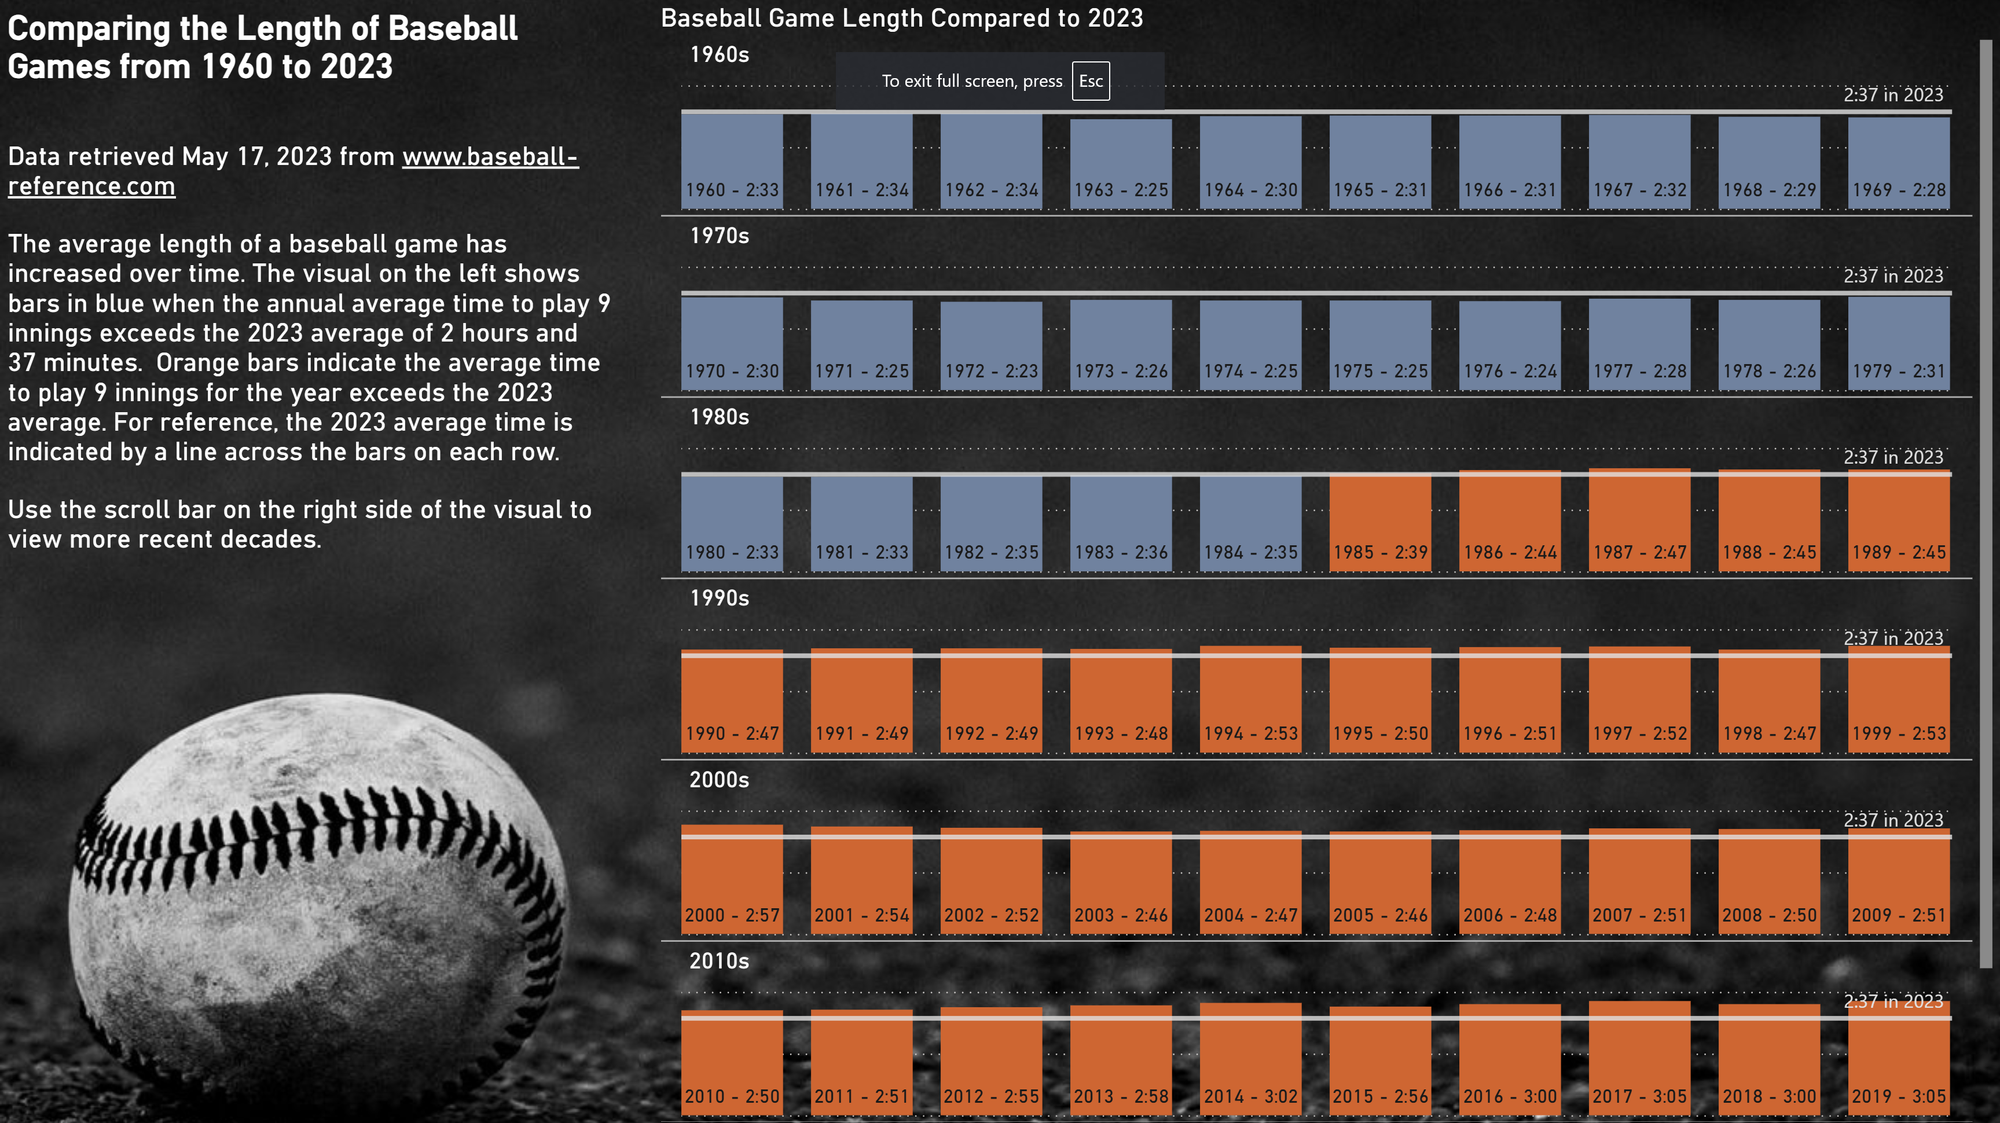
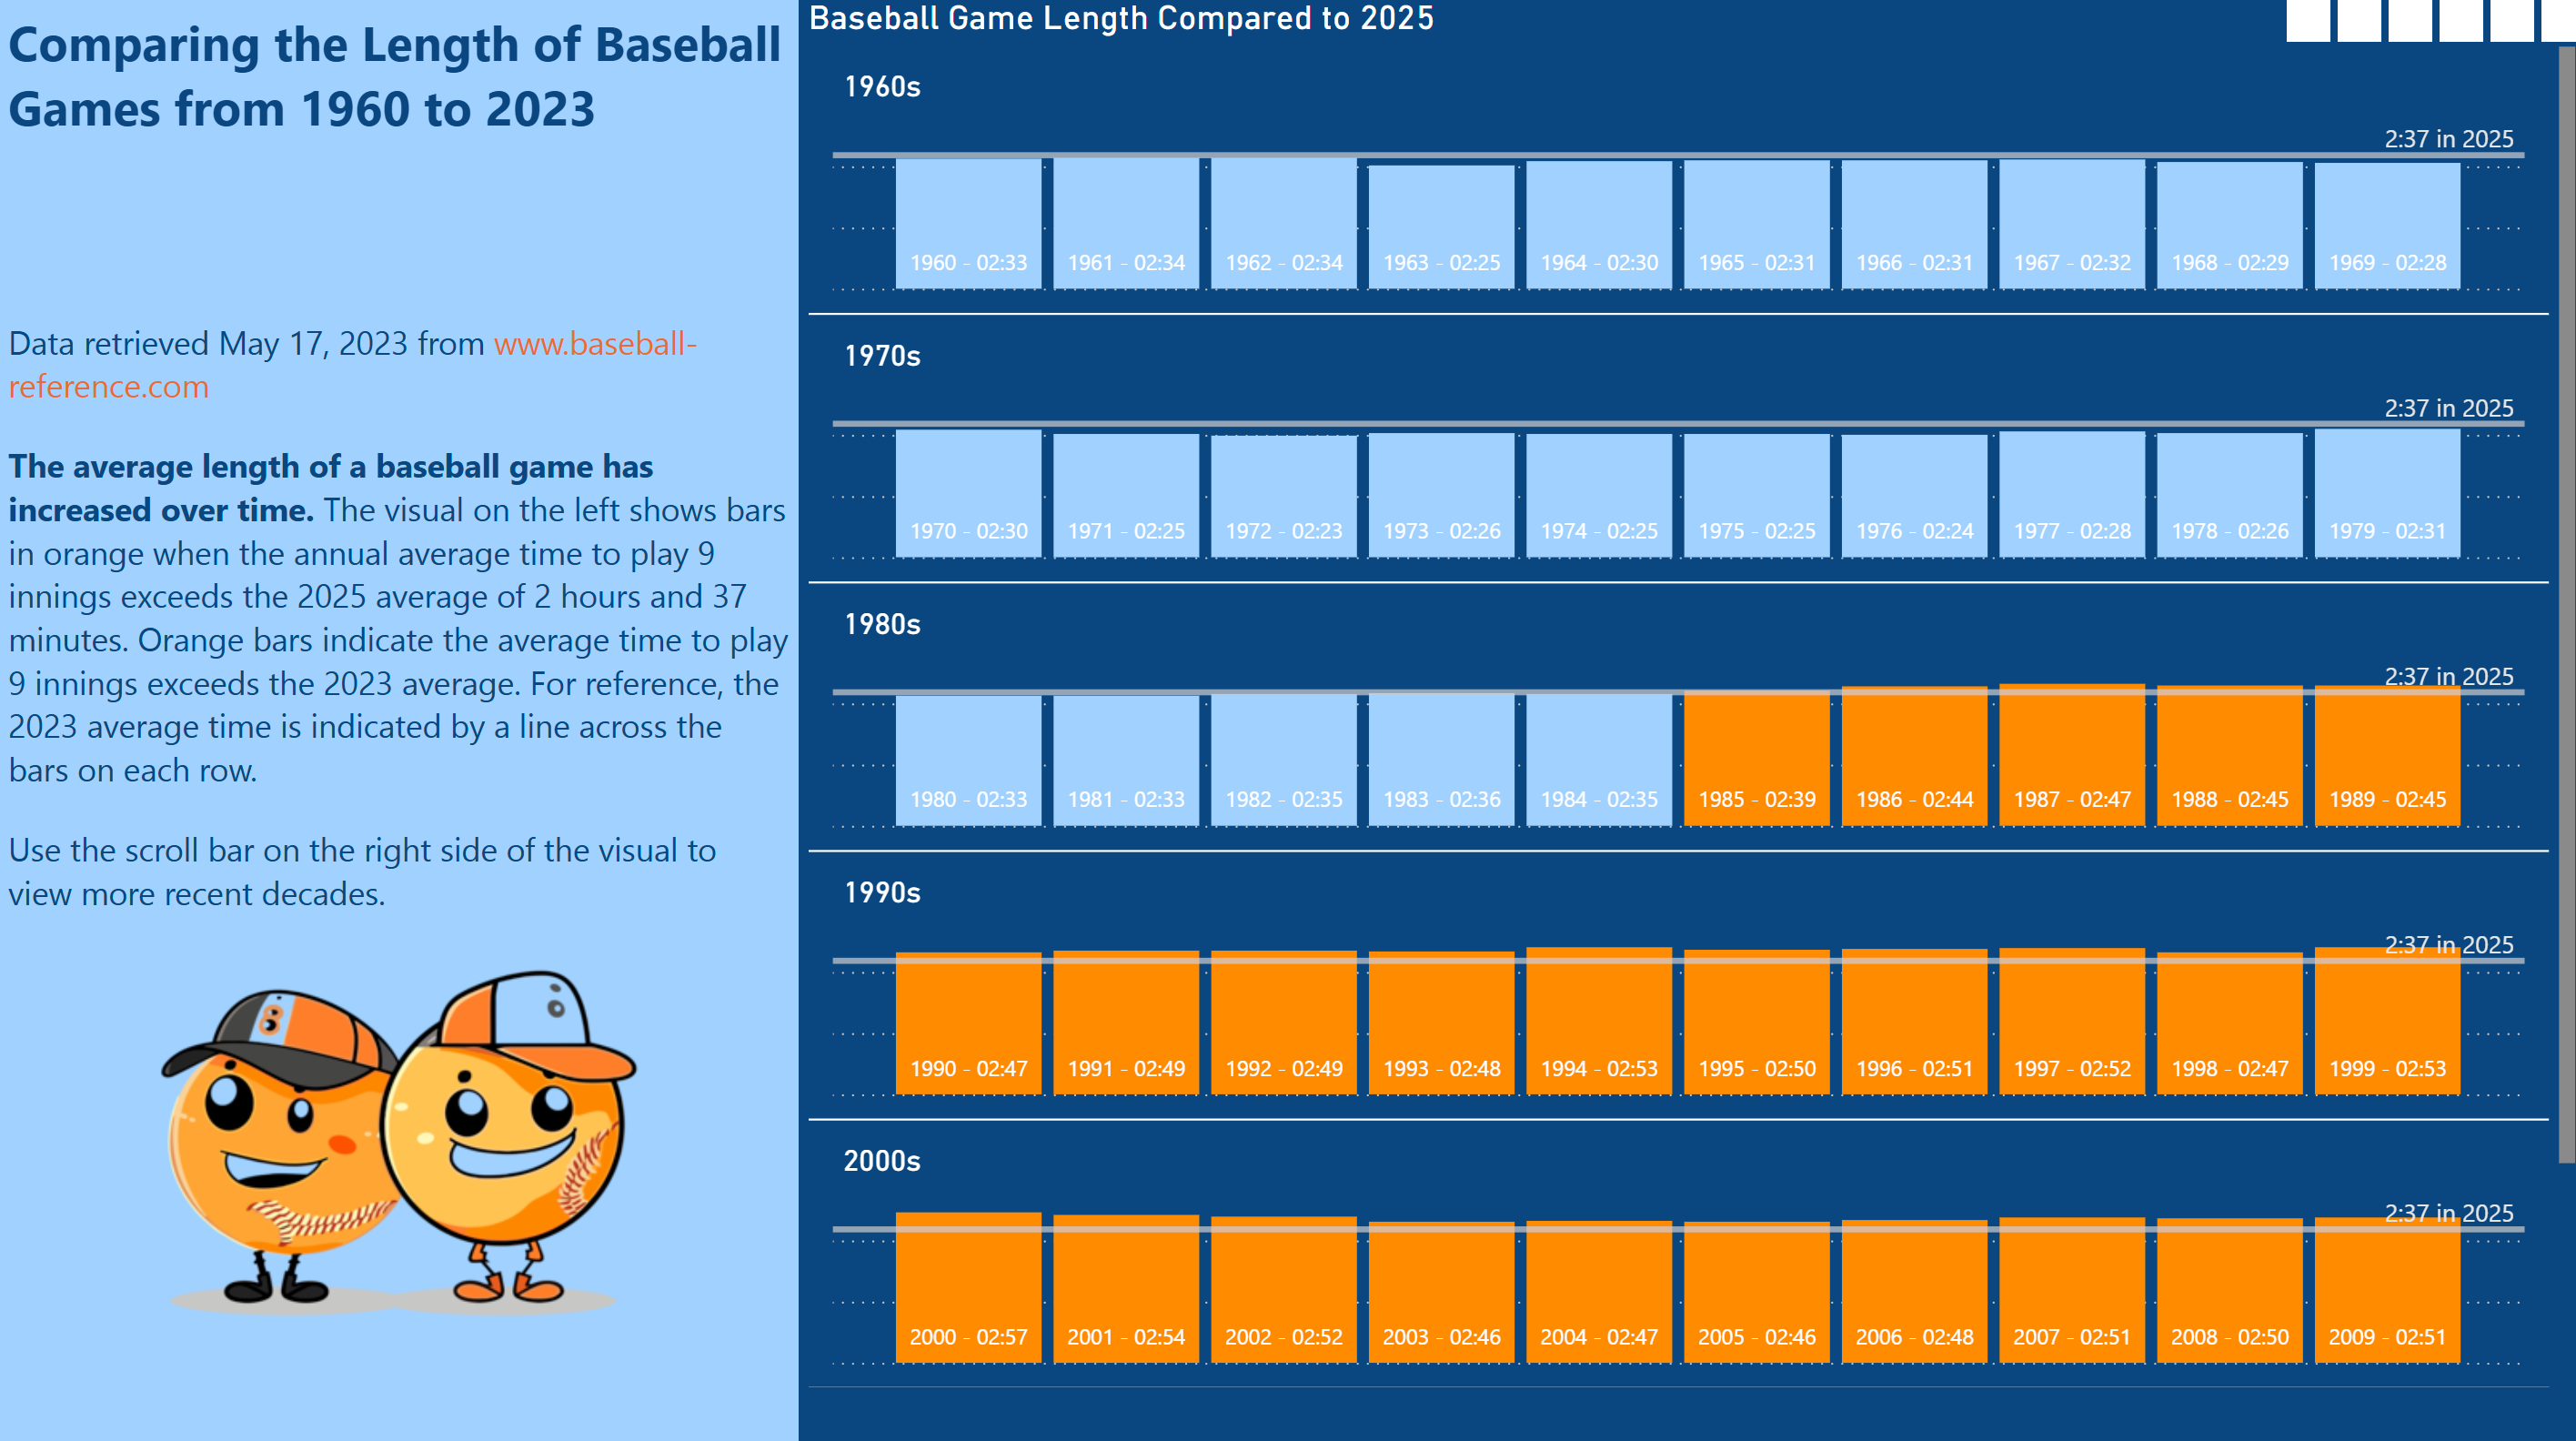
We ended the day with a “Workout Wednesday” challenge, looking at how the average length of baseball games has changed from 1960 to 2025. It was an ideal way to apply the DAX concepts we learned, using calculated columns for colour options and custom axis.