


Before going into the calculation itself, it is worth briefly covering variables. VAR allows a value to be calculated once and then referenced multiple times within the same measure, improving both performance and readability. This calculation makes use of several variables in order to correctly determine the date range, before this is passed into the final RETURN statement. More information about variables in DAX coding can be found in this blog.
Explaining Each Part
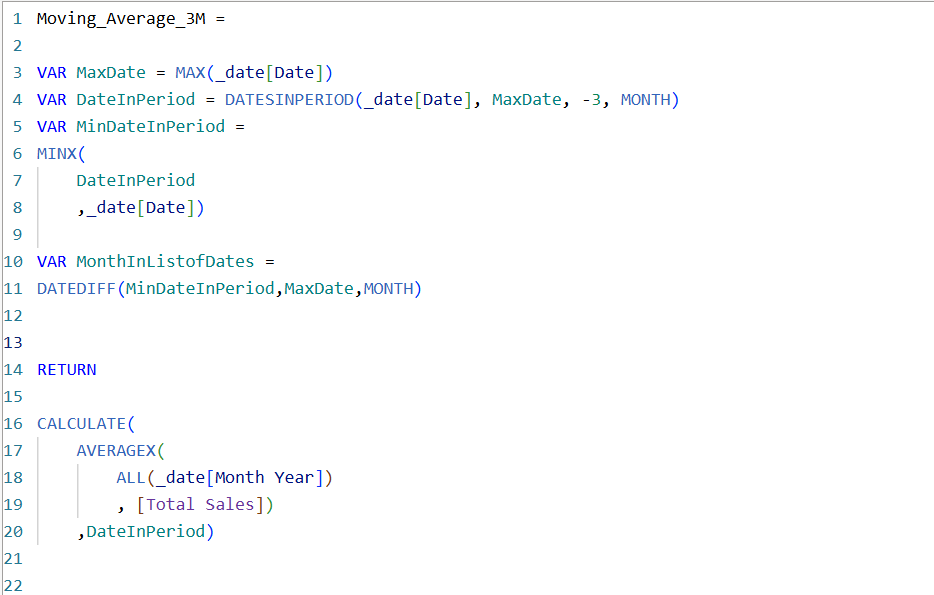
MaxDate is the first variable to be calculated, and finds the latest date present within the current filter context. This acts as the anchor point from which the moving average window is built, as every other variable in the calculation is worked out relative to this date.
DateInPeriod then uses DATESINPERIOD to return a table of every date falling within the three months prior to MaxDate. This is effectively the "window" of dates the moving average will be calculated over, and is the variable which does the heavy lifting later in the RETURN statement.
MinDateInPeriod takes the table produced by DateInPeriod and, using MINX, finds the earliest date within it. This variable is significant as it identifies where the three month window actually begins, rather than assuming it starts three calendar months back regardless of the data available.
MonthInListofDates uses DATEDIFF to calculate the number of months between MinDateInPeriod and MaxDate. This variable is what allows the calculation to identify whether a full three month period of data is actually present, which becomes important when handling the earliest points in a dataset where a full backlog of months is not yet available.
The RETURN Statement
The RETURN statement is where the variables above are brought together to produce the final result. CALCULATE is used to modify the filter context, taking AVERAGEX and applying it across ALL(_date[Month Year]), which removes any existing filters on the date table so that every month is available to be averaged. This is then filtered down to only the dates found in DateInPeriod, meaning the average of [Total Sales] is calculated exclusively across the three month window defined earlier in the calculation.
The result is a moving average which is accurately anchored to the correct rolling window of dates, rather than a rigid three calendar month assumption which may not reflect the data actually present.
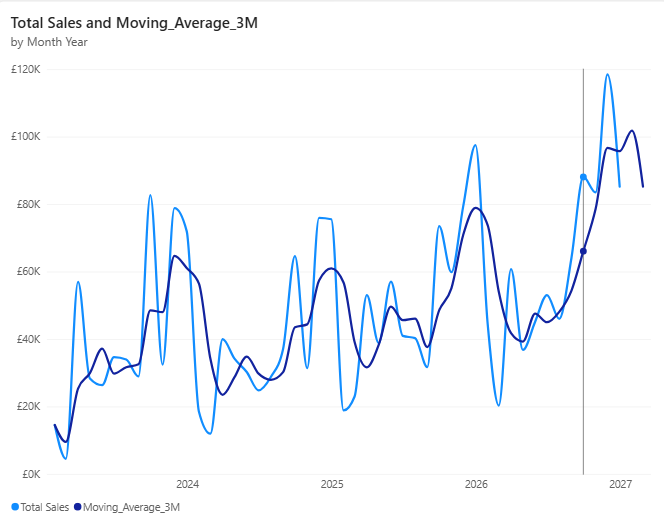
If a quick solution is needed, this calculation is appropriate to use. However, there is a limitation worth being aware of, as can be seen in the image above, the moving average line continues to move further than the line in which there is actual data. This happens because the calculation only takes into account the dates which are available in the date table, rather than the dates which actually have sales data points against them. This means the calculation continues to make up an average from the current point and the previous points until the condition set within DATESINPERIOD is no longer met, regardless of whether real sales data exists for those points or not. For the correct way of handling this, where this issue does not occur, see my next blog post.