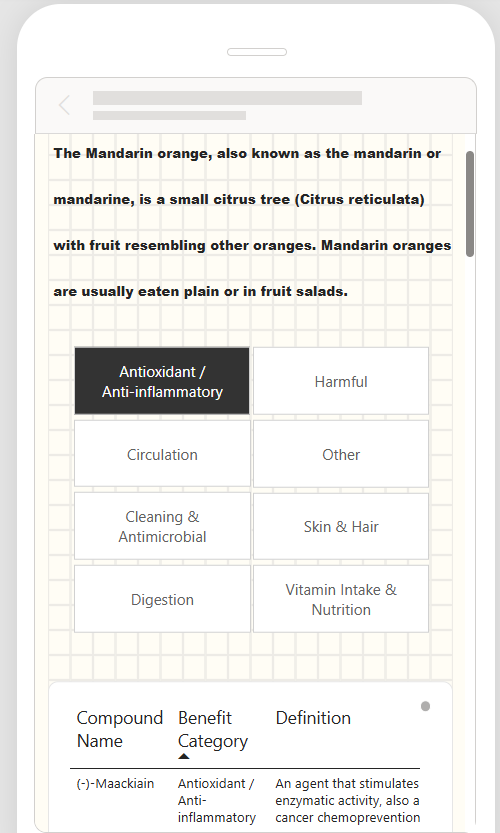
The final project of the week came with a brief that made it more interesting than the ones before it. Alongside building a dashboard, a mobile view also had to be created, and it had to be interactive. Mobile view in dashboarding is a concept that is very much available but less thought about, even though phones are realistically used more than desktops. That made it a great opportunity to start incorporating it into my portfolio.
The Brief
The requirements were quite specific:
- The dashboard had to be the size of the screen, so no endless scrolling.
- A mobile view was required, and it had to be interactive.
- The scope of a big dataset had to be narrowed down to a single item, looked at from both its food description and its health effects and compounds.
- A sketch of the wireframe had to be shown before building.
Why does the mobile view matter?
Most people will open a dashboard on their phone before they open it on a desktop, yet mobile layouts are often treated as an afterthought. Designing for a smaller screen forces you to decide what really matters, because there is no room for everything. A desktop dashboard can get away with a lot of charts, whereas a mobile one can’t.
Narrowing the Scope
The website and the available dataset held so much information, across so many different foods and food groups, that it was important from the very beginning to narrow everything down. The aim was to find a food group or item that would allow for a proper analysis rather than a surface-level look at everything.
After a couple of iterations, the focus landed on citrus fruits, and specifically mandarins. Mandarins have more than 600 compounds in them and they're one of my favourite fruits, which is plenty to build a visualisation around. That gave the dashboard one clear item to tell its story with, looked at from both its food description and its health effects and compounds.
The wireframes
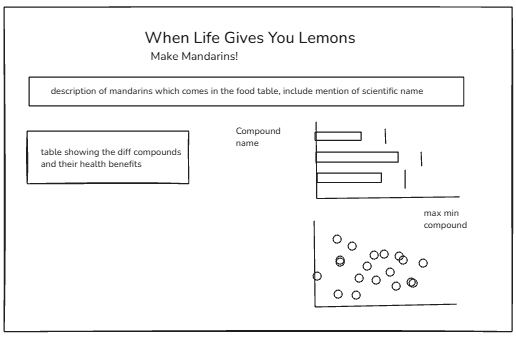
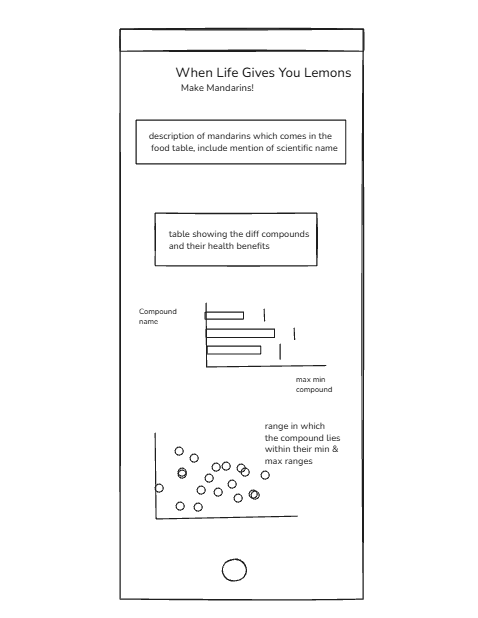
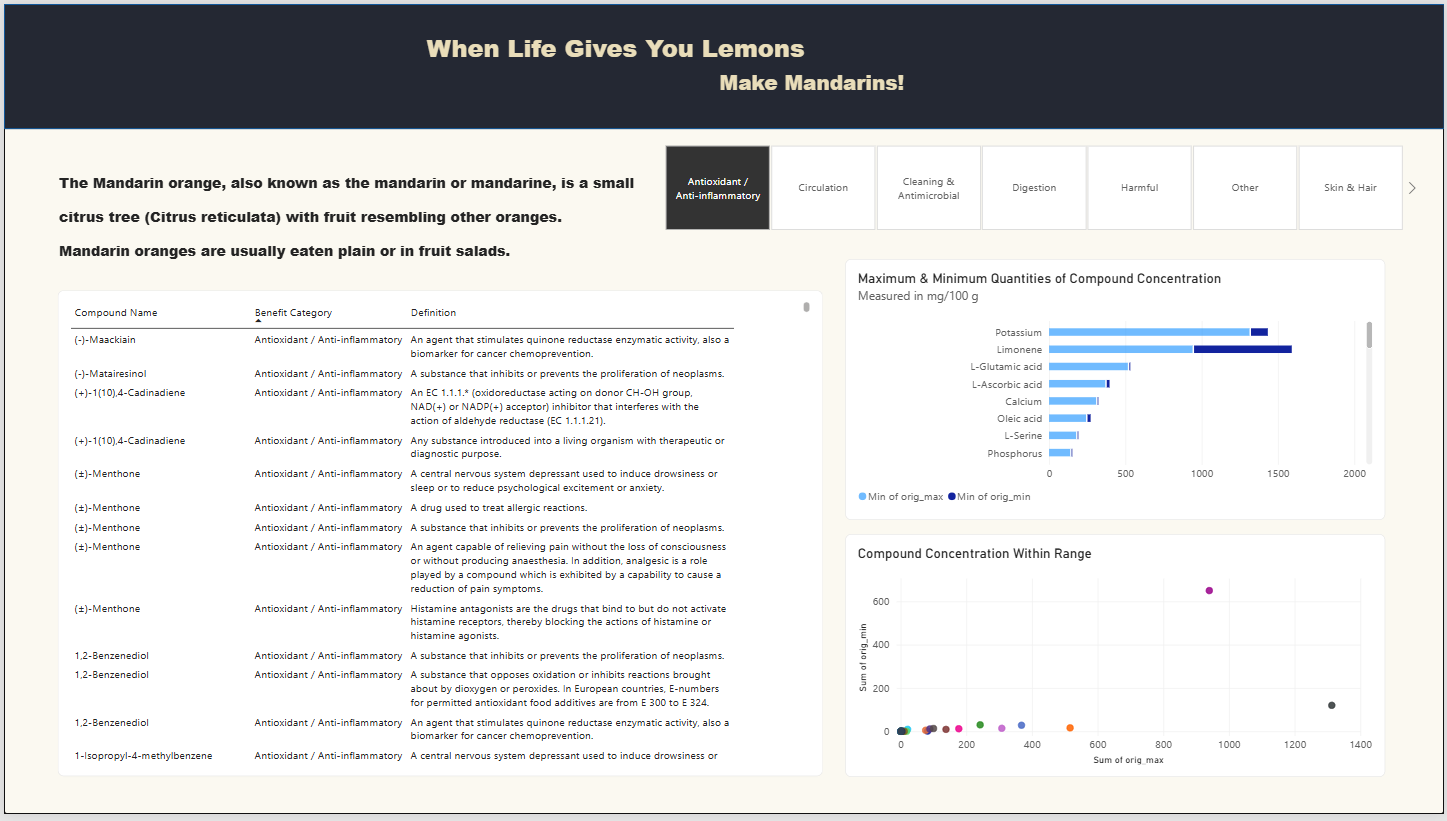
This is the finalised dashboard. As there were so many different health benefits and compounds, the decision was made to split the dashboard up by benefit, so that each one could be explored on its own without overwhelming the viewer.
Splitting by benefit also kept the dashboard within the size of the screen, which was one of the requirements of the brief. Rather than trying to display every compound at once, each view focuses on a single health benefit and the compounds linked to it.
The mobile view layout was interesting to work with, as it required extra planning compared with the desktop view. Sizing in particular had to be thought through carefully, because the charts needed to be visualised as they would appear at the end, rather than at the beginning.
On desktop, there is room to place a chart and adjust it afterwards, whereas on a mobile screen every chart competes for limited space. Each one had to earn its place, and in some cases a chart that worked well on desktop had to be resized or simplified.