No, there's no typo in the heading. Every Friday we get some task that we have to finish within a few hours. Afterwards we each do a presentation about what we did and how, honing our presentation skills as we go. So this week's task has been very much like a Makeover Monday, only that it happened to be Friday. So on a Makeover Monday you basically find a visualization on this website and try to make it better.
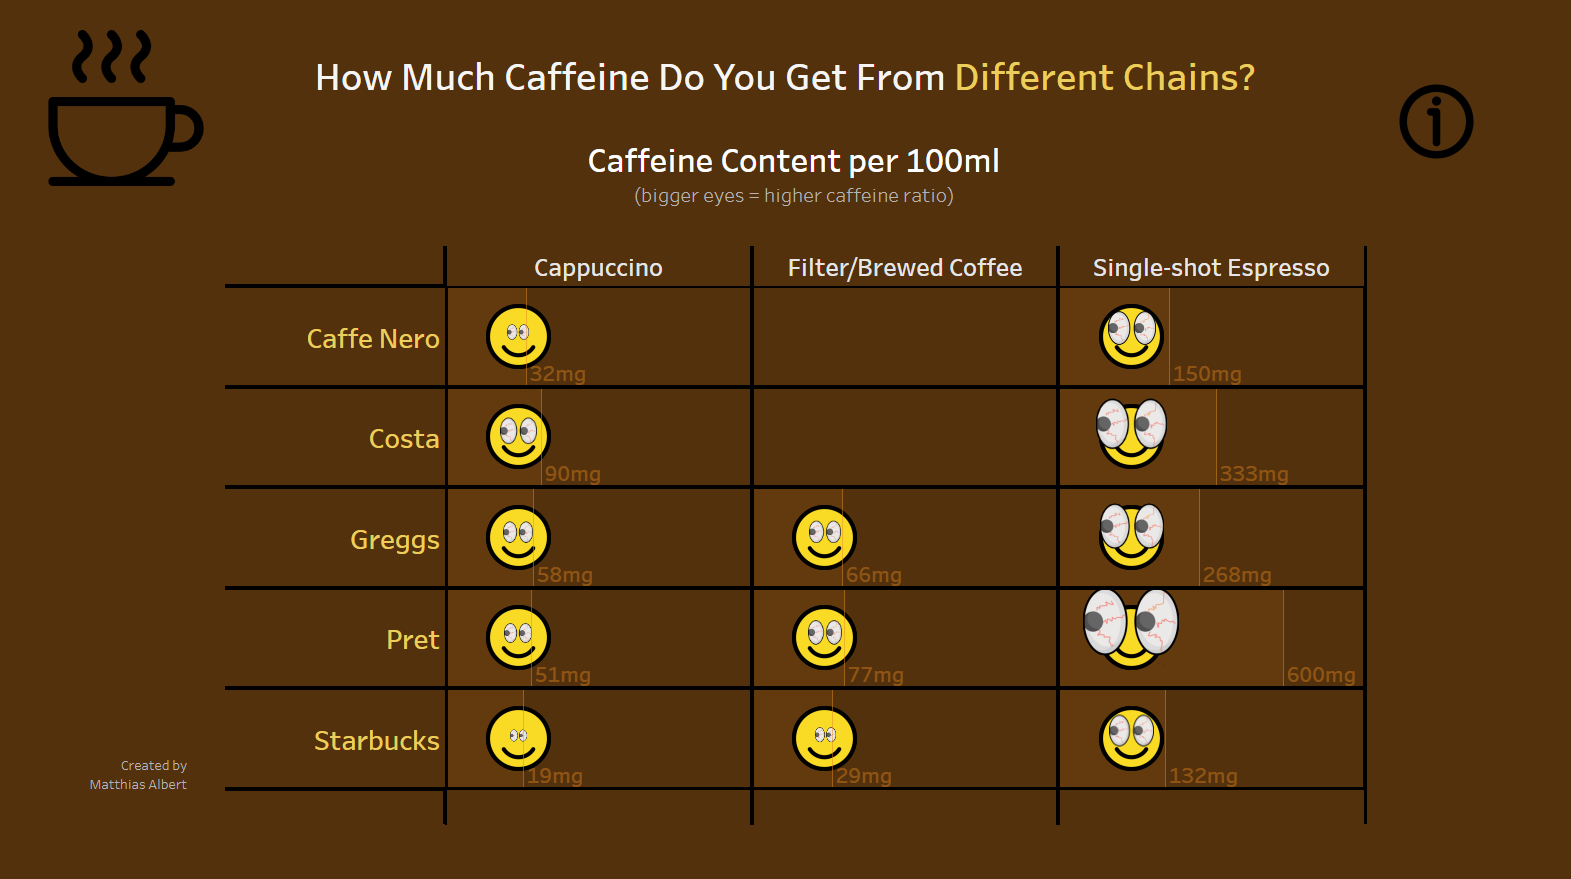
In this blog post I'll just expose you to three images. The first one contains the original visualization as used in this article. The second image shows my sketch detailing both a critique of the visualization and the planned steps to build a visualization that conveys the message in a better way in my view. Finally there is a screenshot of the final product, my own version of the visualization based on the same data, which you can find here. Both the original visualization and my version use this dataset.