


Hi everyone! Today marks the final day of my capstone project, where I've been exploring the potential impact of combining the Paramount+ and HBO Max streaming catalogs following Skydance Corporation's acquisition of Warner Bros. Discovery.
While the acquisition has been completed, the exact details of how the streaming catalogs will be integrated remain uncertain. For this project, I explored a hypothetical scenario in which the two catalogs were combined to understand the potential opportunities for content expansion.
In my previous post, Day 4: Building the Dashboards, I had nearly completed my Executive Overview and was beginning to sketch out my Analyst Overview. With the data preparation and initial dashboard development behind me, the final day focused on completing both dashboards, refining the user experience, and delivering a fully interactive business intelligence solution.
Executive Overview
What I Updated
Building on yesterday's progress, I finalized the Executive Overview by adding user selection controls and a navigation panel on the left-hand side of the dashboard.
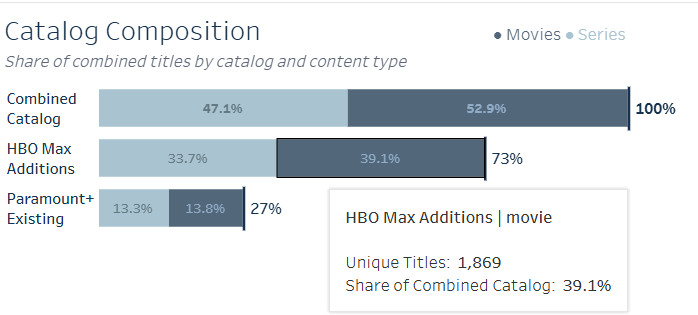
I also refined the formatting throughout, including the titles, tooltips, colors, and overall layout. One of my final adjustments was updating the Movie vs. Series Composition visualization to better represent how each platform contributes to the combined catalog.
What It Delivers
The ultimate goal of the Executive Overview was to allow an executive at Skydance Corporation to understand the potential impact of the catalog merger within a 60-second glance.
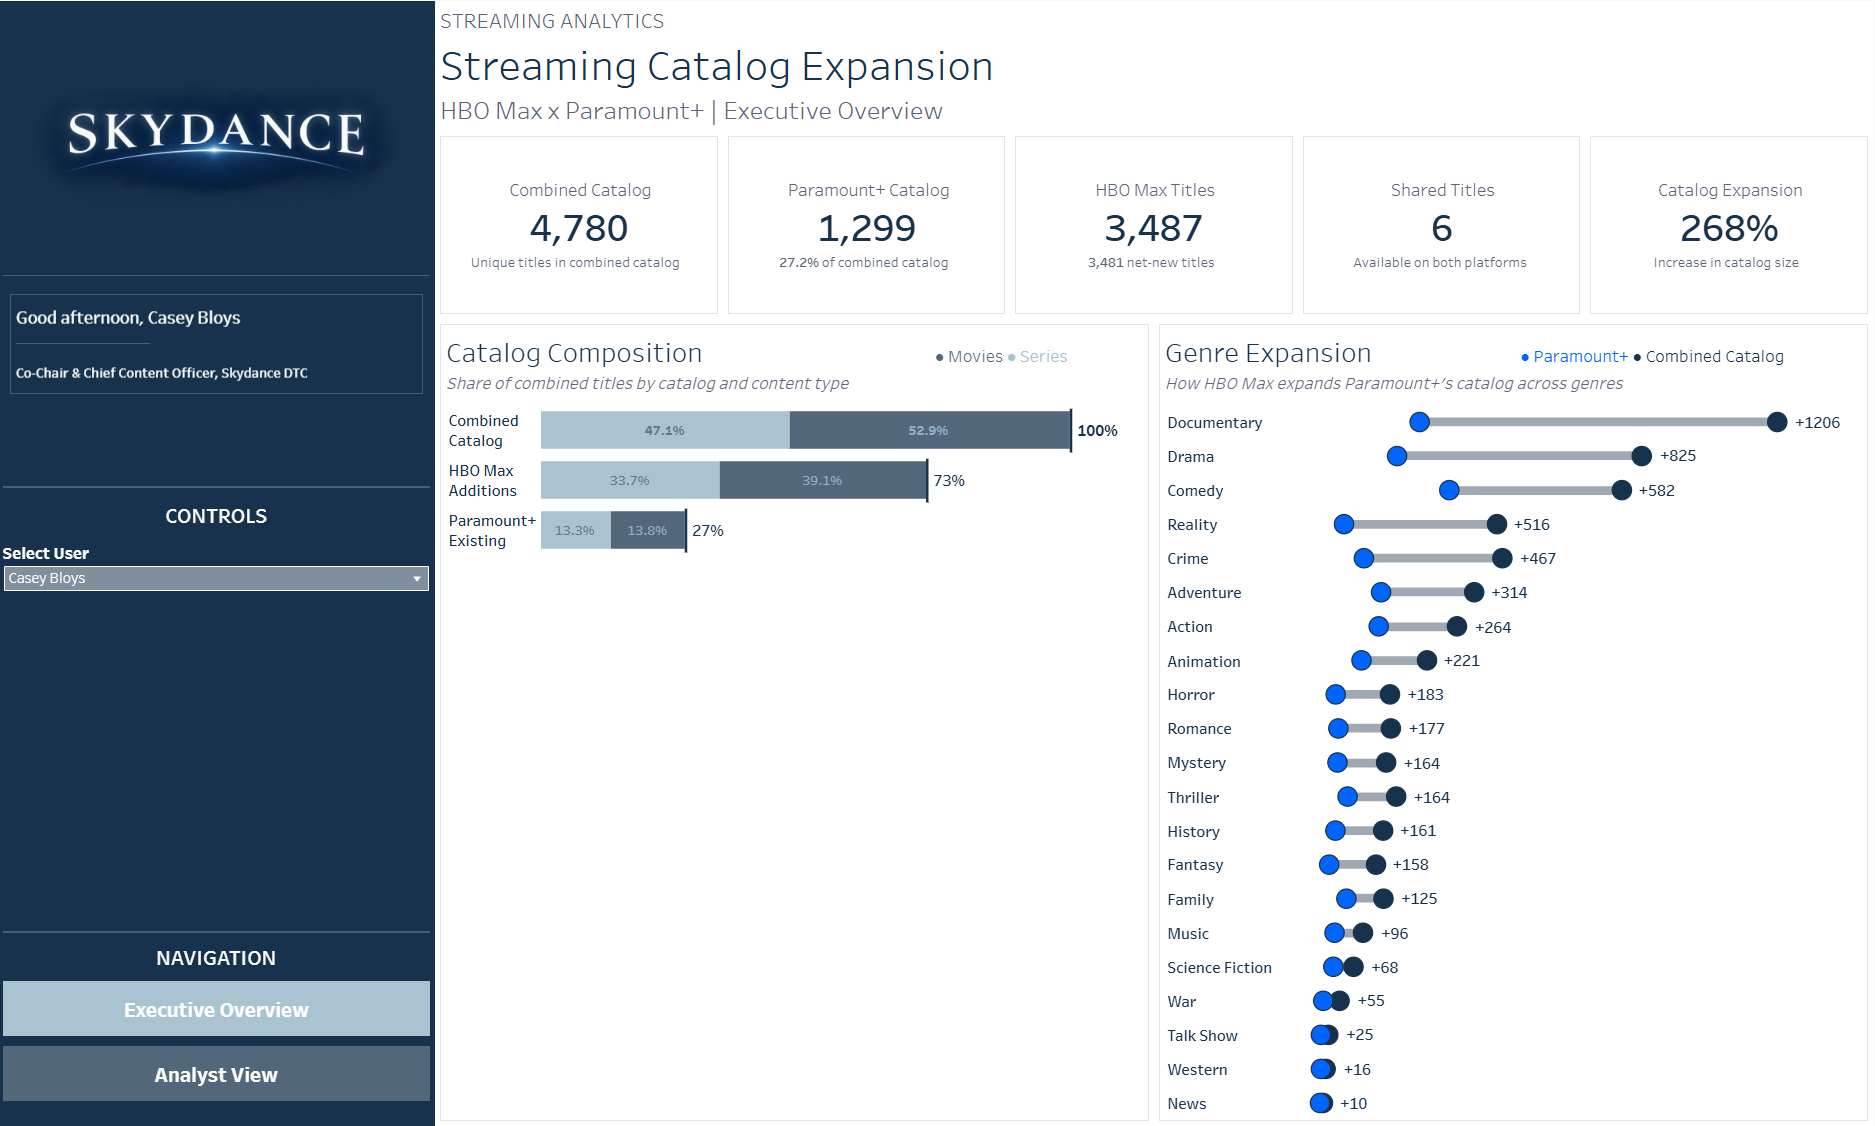
The dashboard provides a high-level overview of the combined catalog, including the existing Paramount+ library, the additional titles introduced by HBO Max, overlapping content, and the overall percentage increase in catalog size.
Across both platforms, the analyzed dataset contains 4,780 unique titles, with 3,481 new additions from HBO Max. This represents a potential 268% expansion of the existing Paramount+ catalog within the dataset.
Beyond these high-level metrics, executives can explore the composition of movies and series across the two platforms, as well as the genres that would benefit most from the merger.
For example, the three genres receiving the largest additions from HBO Max are:
- Documentary: 1,206 titles
- Drama: 825 titles
- Comedy: 582 titles
Together, these insights provide executives with a quick understanding of the potential impact of combining the two streaming catalogs and where the greatest content expansion opportunities exist.
Analyst Overview
What I Updated
While the Executive Overview was largely completed on Day 4, the Analyst Overview still needed to be built.
I began by creating the key performance indicators and developing the visualizations I had previously sketched. From there, I organized the charts into the dashboard, applied consistent formatting, and introduced additional controls to make the analysis more interactive.
One of the main features I incorporated was the ability to switch between different views and metrics using Dynamic Zone Visibility (DZV) and Measure Switching. This allows users to explore the catalog from different perspectives without needing a separate dashboard for every question.
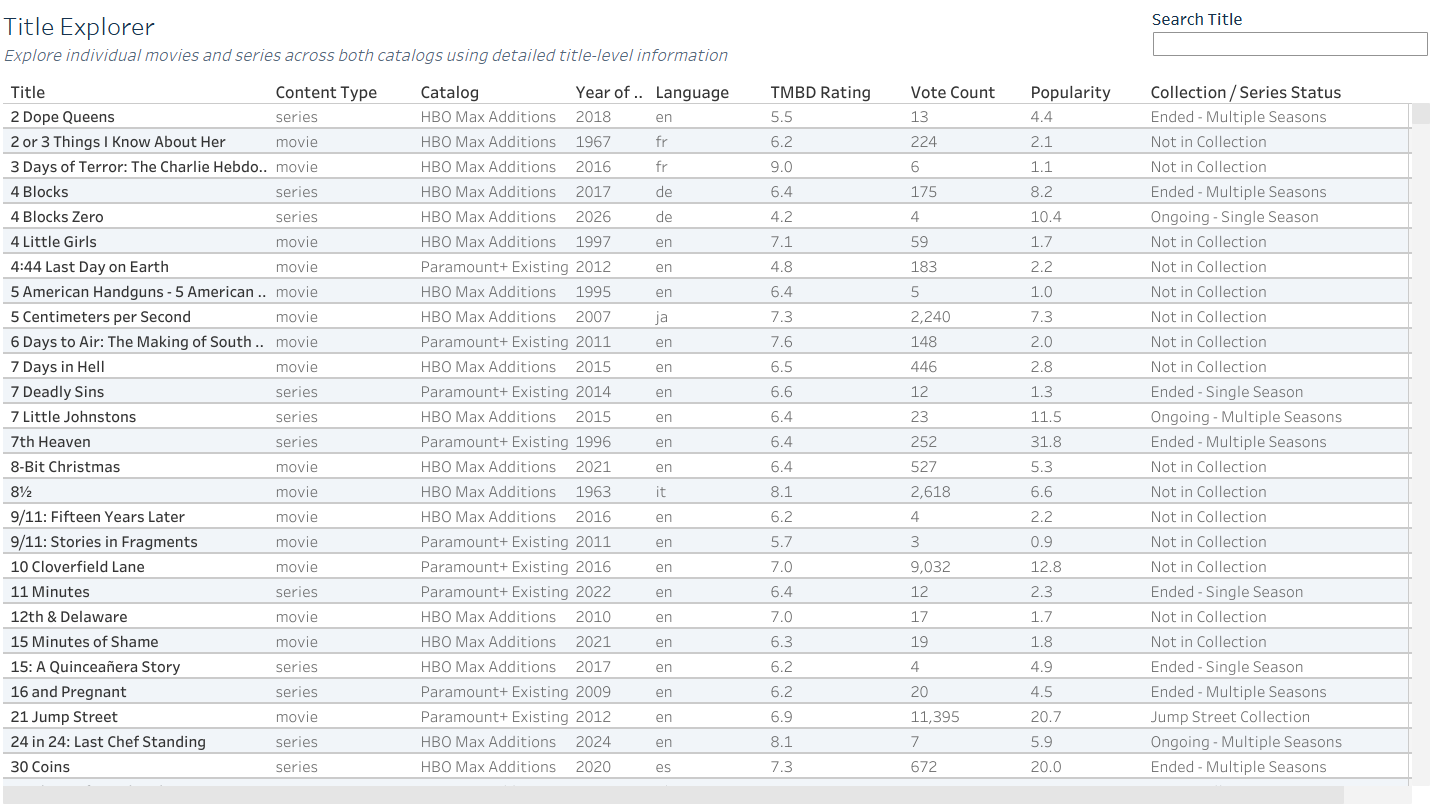
I also created a Title Explorer, accessible through the navigation panel, which allows analysts to search for and investigate individual movies and series within the combined catalog.
What It Delivers
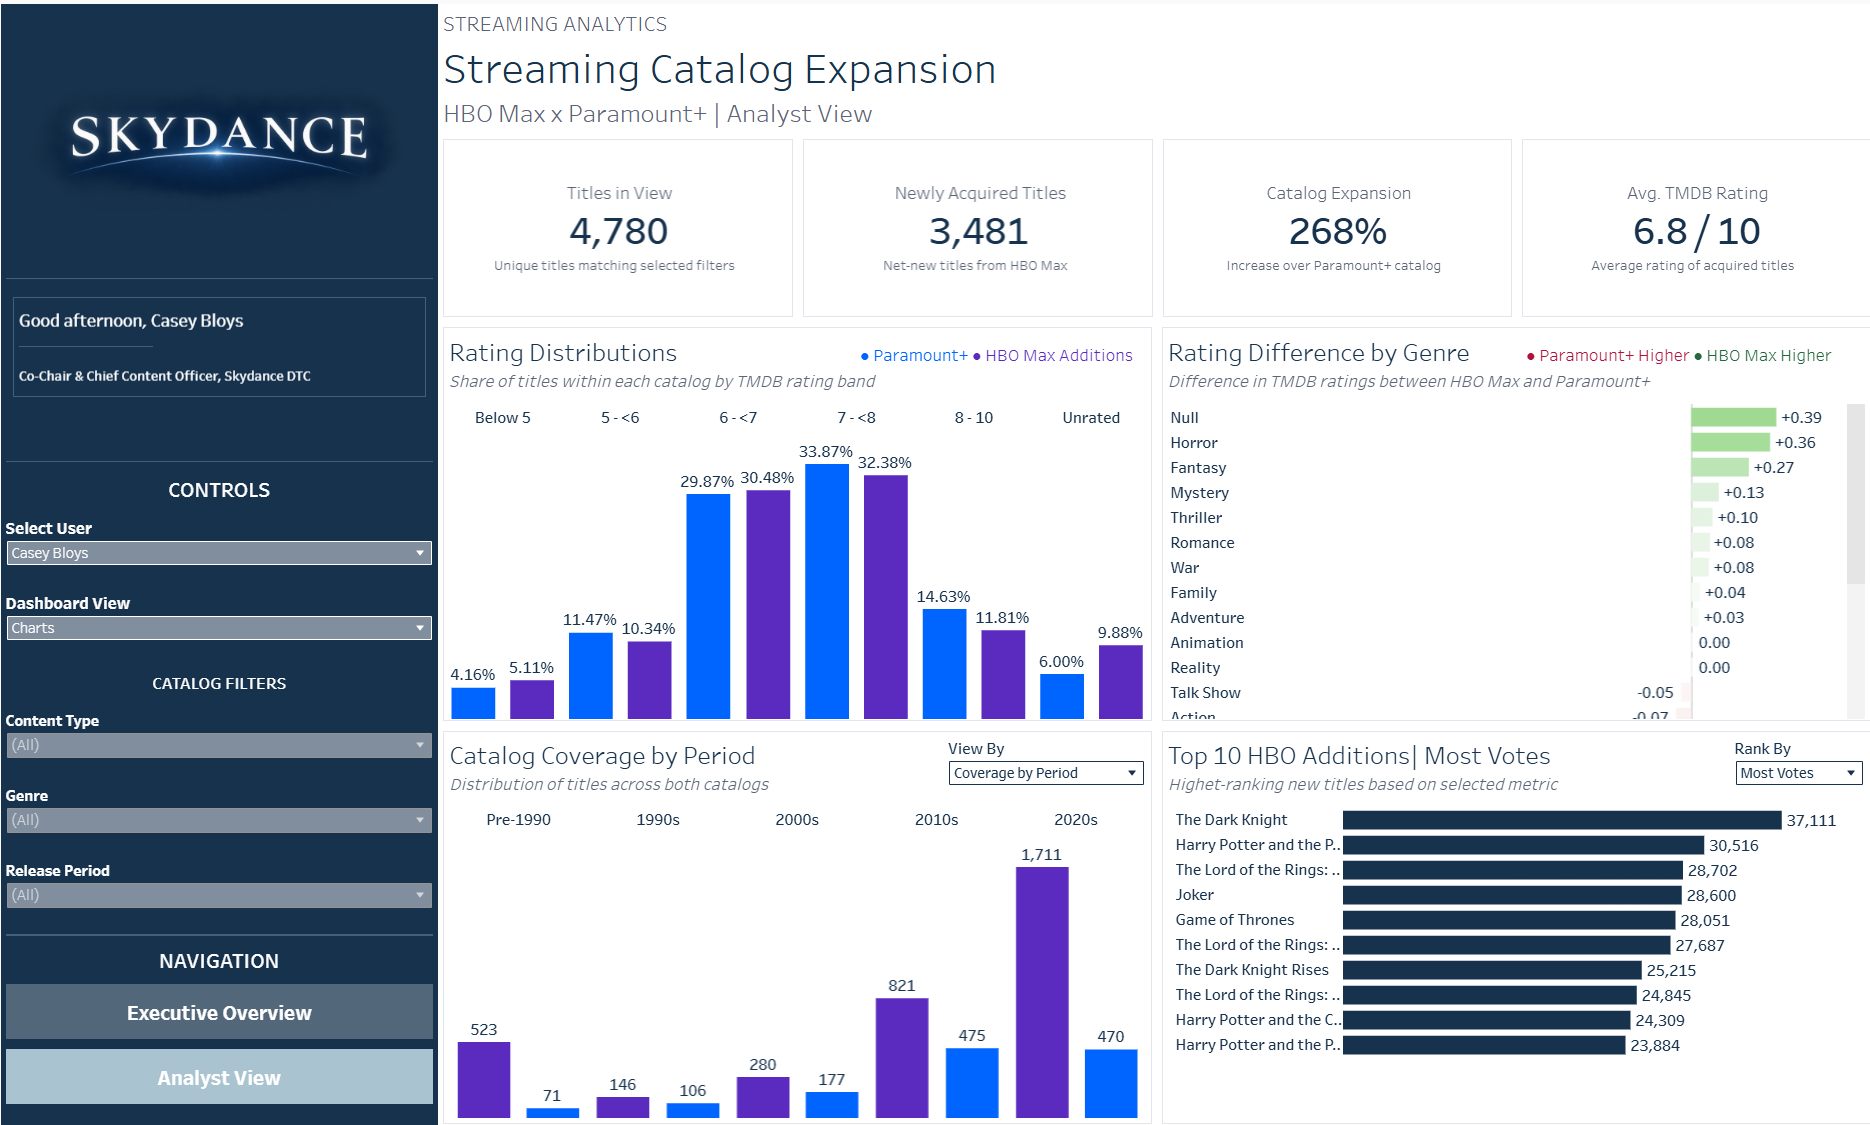
Unlike the Executive Overview, which focuses on the overall impact of the merger, the Analyst Overview was designed for a Content Strategy Analyst who needs to investigate the actual content HBO Max would bring to Paramount+.
The goal is to move beyond simply understanding how many titles are being added and begin exploring the quality, characteristics, and potential opportunities within those additions.
For example, analysts can explore:
- Content Quality: Examine the distribution of TMDB ratings to understand how the additional HBO Max titles compare with Paramount+'s existing catalog and whether the additions introduce more highly rated content.
- Catalog Coverage: Explore the distribution of titles by release period to understand whether HBO Max introduces newer releases or expands the historical catalog.
- Genre Performance: Compare average TMDB ratings across genres to identify where one platform's content performs better than the other's.
- Standout Titles: Investigate individual titles using metrics such as ratings, popularity, and vote counts to identify content worth further exploration.
Beyond these visualizations, the Title Explorer allows analysts to examine individual movies and series in greater detail, providing a way to move from overall trends to specific content.
Ultimately, this view gives analysts the flexibility to investigate what HBO Max could contribute to the combined library, helping identify potential strengths, gaps, and opportunities for future content strategy.
Final Thoughts
With both dashboards completed, I was able to bring together everything I had worked on throughout the week into a single business intelligence solution, from collecting and preparing the data to building the data pipeline and ultimately designing and delivering the final dashboards.
The Executive Overview provides a high-level perspective on the potential catalog expansion, while the Analyst Overview and Title Explorer allow users to investigate the underlying content in greater detail.
One of my biggest takeaways from this project was the importance of designing dashboards around different users. Even when working with the same underlying data, an executive and an analyst may have very different questions they need answered.
By designing separate experiences for each audience, I was able to create a solution that supports both high-level decision-making and detailed exploration.
Thanks for following along throughout my capstone week! I hope this series provided some insight into the process of taking a project from an initial idea to a completed business intelligence solution.