


Network diagrams are a useful way to visualize relationships between different entities. They can be used to explore social networks, transportation routes, organizational structures, and many other types of connections.
For this project, I wanted to create an interactive network diagram in Tableau using Digimon evolution paths from the video game Digimon Story: Time Stranger. The goal was to allow users to select a Digimon and explore its possible evolutions across multiple generations.
What Is a Network Diagram?
A network diagram is a visualization that illustrates how different entities are connected.

There are two main components:
- Nodes: The individual entities within a network, typically represented by points, circles, or shapes. In this example, each Digimon represents a node.
- Edges (Links): The lines connecting nodes, representing relationships between them. Here, each edge represents an evolution from one Digimon to another.
Networks can also be directed or undirected. A directed network shows the direction of a relationship, while an undirected network simply indicates that two nodes are connected.
For this project, I used a directed network, since each evolution has a defined starting Digimon and ending Digimon. Although the connections are displayed as lines without arrows, the underlying data preserves the direction of each evolution.
Preparing the Data
To build a network diagram, we first need to identify the relationships between our nodes. At its simplest, this can be represented using a source and target.
| Source | Target |
|---|---|
| Agumon | Greymon |
| Greymon | MetalGreymon |
| MetalGreymon | WarGreymon |
Each row represents an edge connecting two nodes.
Depending on the visualization tool, node positions may be generated automatically. However, for this Tableau project, I needed to prepare coordinates to determine where each Digimon would appear.
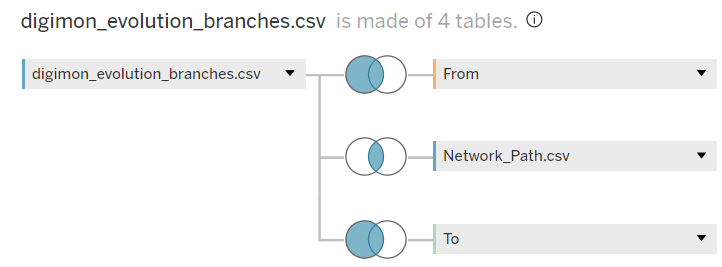
I used three CSV files:
- Evolution Branches: Contains the evolution relationships between Digimon, organized by starting Digimon.
- Node Layout: Contains information used to position each Digimon, such as its evolution depth, rank, and number of nodes at that depth.
- Network Path: Contains two records used to distinguish the starting and ending points of a connection.
Within Tableau, I joined these files together, using the Node Layout table twice: once for the From Digimon and once for the To Digimon.
This resulted in four physical tables built from three CSV files.
With the data prepared, the next step was to use Tableau's spatial functions to create the network.
1. From Point and To Point
I first created two calculated fields, C - From Point and C - To Point, using Tableau's MAKEPOINT() function.
This function creates spatial points from coordinates, allowing Tableau to position each node within the network.
For this project, I used more detailed calculations to organize the Digimon by evolution depth and adjust their spacing based on the number of nodes. However, if your dataset already contains node coordinates, these calculations can be much simpler.
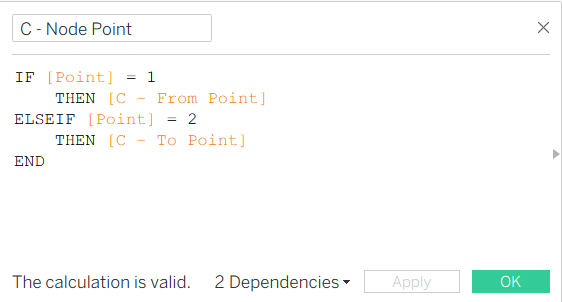
2. Node Point
Next, I created C - Node Point to determine which spatial point to display based on the Network Path field.
The calculation selects either the From Point or To Point depending on whether the path record represents the starting or ending node.
This allows Tableau to display both Digimon involved in each evolution connection.
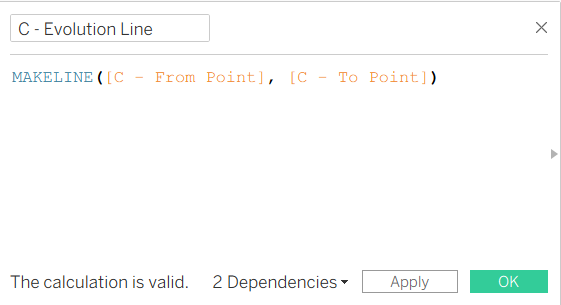
3. Evolution Line
Finally, I created C - Evolution Line using the MAKELINE() function.
The MAKELINE() function creates a spatial line between two points. By connecting the From Point and To Point, Tableau can display the evolution relationships as edges within the network.
Building the Network Diagram
Once the calculated fields were ready, I could assemble the visualization using Tableau's Marks layers.
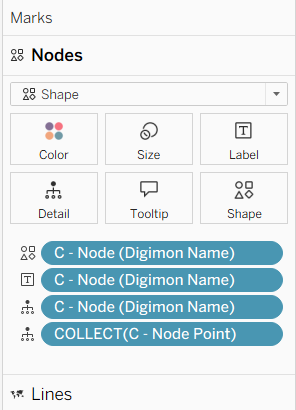
I created two layers:
- Lines: A Map Marks layer using
C - Evolution Lineto display the connections between Digimon. - Nodes: A Shape Marks layer using
C - Node Pointto display each Digimon.
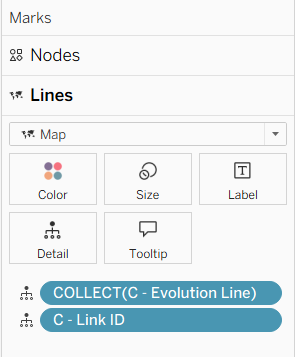
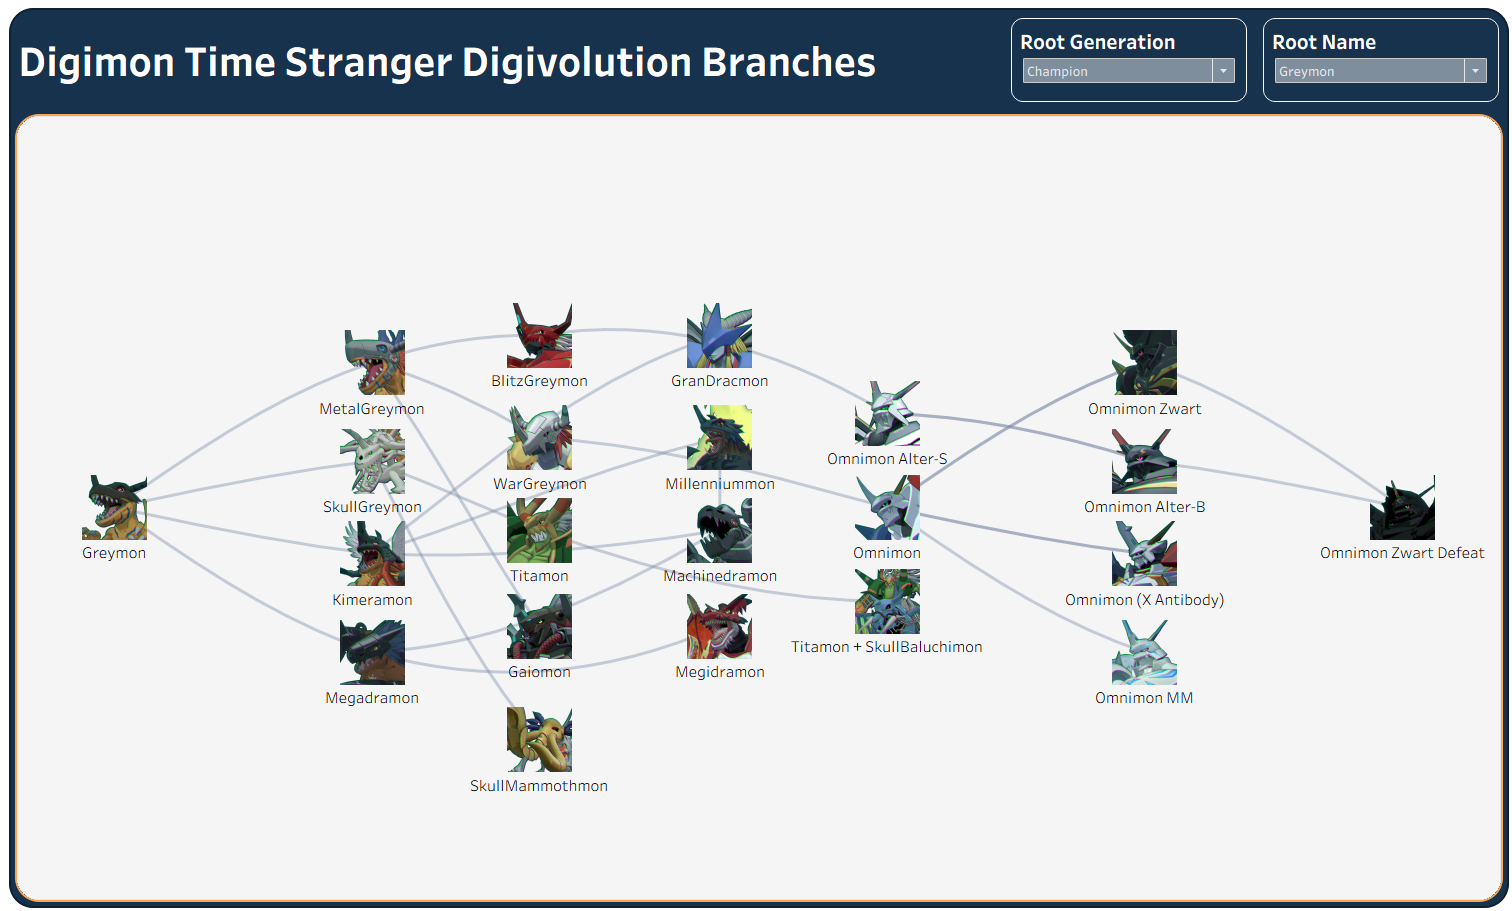
For the Nodes layer, I used the Digimon Name calculation on Detail, Label, and Shape. I then replaced the default Tableau shapes with custom Digimon images to make the visualization easier to explore.
Finally, I added Root Generation and Root Name filters, allowing users to select a starting Digimon and view its available evolution paths.
Final Thoughts
Network diagrams provide a useful way to explore relationships that might be difficult to understand through traditional tables or charts.
Although this project required additional data preparation to organize the Digimon evolution paths, the underlying concept remains straightforward: identify the nodes, define their connections, and determine how to position them within the visualization. By combining these elements with Tableau's spatial functions, I was able to create an interactive network diagram that allows users to explore different evolution paths.