


In this article, I will outline my process for creating the Cake Works Dataset, which I had mentioned in my previous article. In that article, I explained about the company, its business objectives and the set of business questions they’re hoping to answer with the dataset that will be created in this article! Beyond all of that, I will also comment on whether or not the created dataset is capable of actually answering some, if not all, of the business questions.
To begin, I will be showcasing how Mockaroo can be used to create “realistic'' fake data and why it may be important for data practitioners to be able to create mock data. Ultimately, I will explore how the Cake Works Dataset is positioned to address the company’s business objectives and questions.
With all of that out of the way, a brief introduction to Mockaroo is in order. Mockaroo is a tool, written in the Ruby programming language, that can be used to generate realistic fake data, which can be exported to common file formats such as CSV or Excel and many others. The data that can be generated can range from geographic data to the scientific names of animals and pretty much everything in between. You can write your own logic which can be used to simulate “true/false” flags or to inform the distribution of data within a field. Mockaroo comes with accessible and comprehensive documentation which makes using it intuitive and quite versatile! Beyond that, if you want to get started straight away, consider following its YouTube playlist!

In the image above, we can see where the magic happens in Mockaroo. As you can see at the top, there are three main sections that affect how data is created. The first section is self-explanatory so I won’t speak on it. The second section, “Type”, refers to the particular data type of the field. There are many data types that Mockaroo recognizes, such as number, boolean, row number (an index value) and even custom lists. Custom lists can be set as the value-range of a field manually or dynamically (see the Σ (sigma) symbol). The particular qualities or behavior of a field are determined from the third section, which is “Options”. To be clear, when you manually set a custom list that simply means that you either wrote out or copy-and-pasted the strings that make up the list. On the other hand, a dynamic custom list requires logic of some kind. In the following image, we will see this in action.

In the image above, we can see an example of some logic that you’re able to create in Mockaroo, which can be used to create dynamic custom lists! In this case, the code checks to see if the value of the “name_of_item” field includes the words “Cookie”, “Pie”, or “Cake” as part of the name of the item. If any of those conditions are met, then the “type_of_item” field (not shown in the image) will have the value of either Cookie, Pie or Cake. For example, if an item has the name of “Chocolate Chip Cookie”, then its type will be that of a Cookie. To be clear, in its current form, the logic is case-sensitive, so if an item was named “Chocolate Chip cookie”, then the “type_of_item” field for that item would be null.

In the image above, we are looking at the code that determines whether or not an item is considered seasonal. If you look at the first image, the field that I’m referring to is called “seasonal_item”, which has a Boolean datatype. In this case, this field determines whether or not an item was available on a holiday or not. So, ultimately, this is an example of being able to create “true/false” flags in Mockaroo, which can be helpful in giving additional details about an item. In the following image, we will see how we can use “true/false” flags to create dynamic logic which can affect other fields!
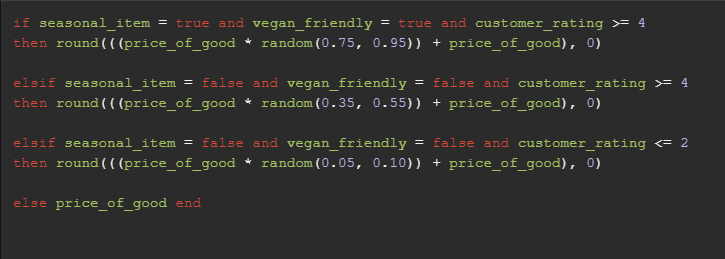
In the image above, we can see the logic that determines the price of an item, known as the “price_of_good” field. Like the aforementioned examples of logic, this example also refers to other existing fields within the dataset. In this case, we are checking the values of three different fields and then setting a dynamic price. For example, if an item is offered during a holiday, is vegan and has a customer rating of 4 or more, then the price of that item will have a random price percentage modifier of between 75% and 95% added onto its base price. For example, imagine an item with all of the aforementioned characteristics. Let’s also say that the item has a base price of $20 and the modifier is 95%. The above logic would set the price of the item as $39. To be even clearer, here is the formula at work: ($20 * 0.95) + $20 = $39. Ultimately, this is meant to simulate price differences between more or less exclusive or “quality” items.

With all of our data creation work said and done, here’s a small sample of the created dataset! The actual dataset, by default, contains 1,000 rows. As we can see, each row represents the relevant information regarding each item from the Cake Works company. We can see the name of an item, how caloric it is, the city and state level location of a Cake Works bakery, whether or not it is a seasonal item and so on.
With that, let’s take a step back and consider why data practitioners may want to utilize a tool like Mockaroo. Straight away, the primary reason why we use this tool would be if you do not have relevant data, either because the data doesn’t exist or is inaccessible. Another reason to use Mockaroo may be if you want to quickly prototype your data products, such as dashboards and vizzes. That is, by using quickly-made datasets for your data products, you reduce the overall time it takes to create and test said products since you can avoid having to wait for access and wait for real data to be ingested into your data products and so on. Perhaps most importantly, in the way of efficiency and time-saving benefits, creating your datasets with Mockaroo will sharply reduce the amount of time it would take you to do data-cleaning. Simply said, this is because you are fully aware and in control of what your data means from a row-level perspective. Every column header and every value for every cell is accounted for. There is no need to consult data dictionaries or reach out to data engineers to ascertain what a column means or whether or not the dataset should be pivoted in some way. With Mockaroo, you are given the means to design datasets from the ground up, so you decide how simple or complex you want your dataset to be.
To begin, let’s work out the questions that are relatively easy to answer with the current dataset. Questions 1-3, the first part of question 5 and question 9, deal with profitability, amount of purchases, caloric content of baked goods and any other additional insights or changes that could be made to the dataset — they’re all able to be answered by the dataset. The questions are:
1. What type of baked goods are most and least profitable?
2. What type of baked goods are purchased the most and the least overall? What about by region? What about by month?
3. What region has the most or least amount of purchases?
5. What type of baked goods are the most and least caloric? Is there a correlation between calorie count and other qualities, such as customer rating, being vegan friendly, being a seasonal item and so on?
9. Are there any other interesting insights from the present data? Can we generate more insights from adding additional fields of data and if so what fields should be added?
Ultimately, given the current structure and level of detail of the dataset, questions regarding distribution (min, max, average, mode, etc.) are generally more straightforward to address.
Moving on, let’s look at the questions that are either more difficult to answer or are probably impossible to answer. Given that the data is completely random and likely doesn’t follow any discernible historical consumption patterns involving baked goods, questions 4, 6, 7, 8 and the second part of question 5 are questions that the dataset is not capable of answering with any real precision, consistency or actual business value. The questions are:
4. Does the frequency of purchases correlate with price? That is, is an item generally purchased more if it’s inexpensive? Are there any noticeable relationships between price and other qualities of a baked good item?
5. What type of baked goods are the most and least caloric? Is there a correlation between calorie count and other qualities, such as customer rating, being vegan friendly, being a seasonal item and so on?
6. Is there a correlation between how a customer rates a baked good item and whether or not the item is seasonal? What about if the item is vegan? What about if the item contains specialty ingredients?
7. Are there any noticeable trends related to time and purchasing behavior? For example, do more purchases tend to occur during holidays or certain days of the week or certain months?
8. How can we determine which baked goods will continue to sell? Can we determine which baked goods to stop selling? Can we develop promotional events, such as discounts, special sales, and reward programs given the data?
Moreover, the current dataset only contains 1,000 rows of information, which may not be enough to answer these questions, especially question 8 which involves prescriptive analysis (meaning, how should Cake Works act based on the insights from its data?). To learn more about the different types of analysis, please refer to the following introductory article.
Given some of the limitations with the dataset, the leadership team and analytics team of Cake Works should come together to discuss what additional data is needed. This would probably involve having to change how data is collected and what information, behaviors or business processes are being tracked. For example, generally speaking, in order to do any kind of predictive analytics, it would be ideal to have large amounts of historical and current data. More importantly, data shouldn’t be randomized as that completely negates the ability to make predictions. Despite these limitations, conducting ad hoc analysis and reporting are both business functions that the current dataset is able to support.
Having said all of that, let’s recap what was explored throughout this article. First, we introduced Mockaroo. Second, we demonstrated different aspects of Mockaroo and explored how the Cake Works dataset was created. Third, we reflected on why Mockaroo could be useful for data practitioners. Finally, we briefly touched on how the dataset could address the different business questions of Cake Works.
In the next article, we will bring the Cake Works dataset into Tableau and try to explore the data as well as visualize the business questions!