Today was my first time using Power Query and Power BI.
After hearing whispers of the program during the first two weeks, it was nice to finally have a go at the program with a whole day dedicated to it.
Other than going through the structured learning with all the different Tableau programs, it has been a long time since I've been taught an entirely new software.
With such a familiar interface, it wasn't hard to get used to the interface of Power Query and Power BI.
Power Query
Our Power Query session began with getting used to the interface of the data preparation software. With the distinctive ribbon at the tab, it took a few click throughs to get our bearings.
Though we learnt the basics, what I liked the most was the variation in methods to reach the same outcome.

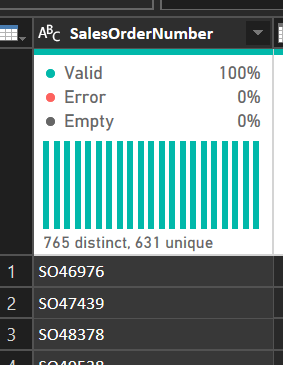
For example, to only obtain the numbers at the end of this string we all did this using different methods:
- Split the column non-digit to digit (delete the string)
- Find and replace 'SO' with ' '
- Extract the last 5 characters
- Extract text after delimiters ('SO')
- Split the column by position 0,2 (delete the string)
Power BI
With Power BI it certainly did feel different from Tableau. I definitely did enjoy the aspect of being able to pull out multiple graphs at once and watch them all change when filtering through different data points.

An aspect which does make me prefer Tableau over Power Bi is the interface. With there being so many aspects that can be customised, sometimes it felt like I was getting lost in all the drop down menus.
Have a look at my published report on the Top 50 below!
