


A few weeks ago I had the pleasure of leading a section of Learning What the Data School Learns. My topic was on Tableau Prep. I had a number of people mention how much they enjoyed the lesson and thought it would be great to give a rundown here. That way anyone else taking the first steps into Prep can have a guide they can follow.
Tableau Prep is a data preparation tool. It cleans, combines, and organizes messy data before you build anything with it. Instead of fixing things row by row in a spreadsheet, you build a flow: a series of steps, each doing one clear thing to your data, connected left to right.
Before You Open the Tool
There are three things worth knowing before you touch anything:
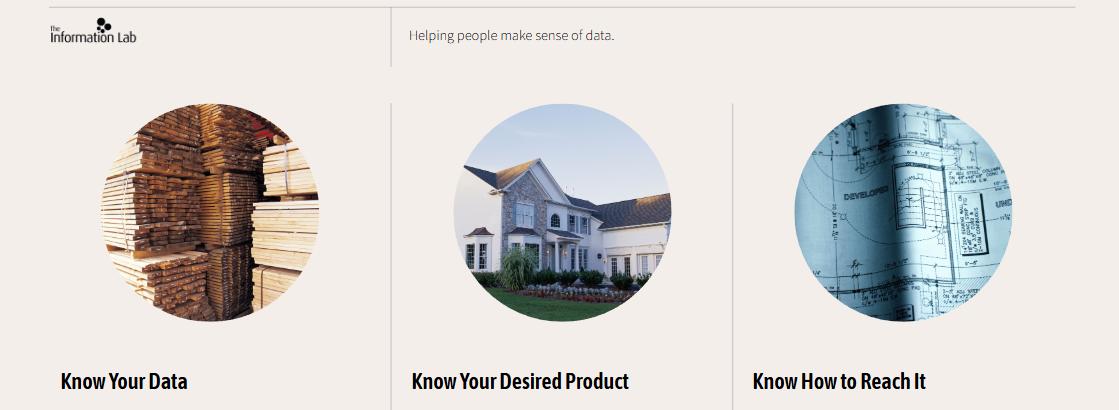
- Know your data. Look at what you actually have. What's missing, what looks wrong, what needs cleaning.
- Know your desired product. Decide what you're building toward first. The same raw data can turn into very different outputs depending on the goal.
- Know how to reach it. Plan the steps that get you from raw data to that final product. Figure out where you'll filter, remove, or aggregate along the way.
What You're Looking At When You Open It
The first time you open Tableau Prep, the screen is mostly empty. No data connected yet. Once you connect something, you're working with four main areas:
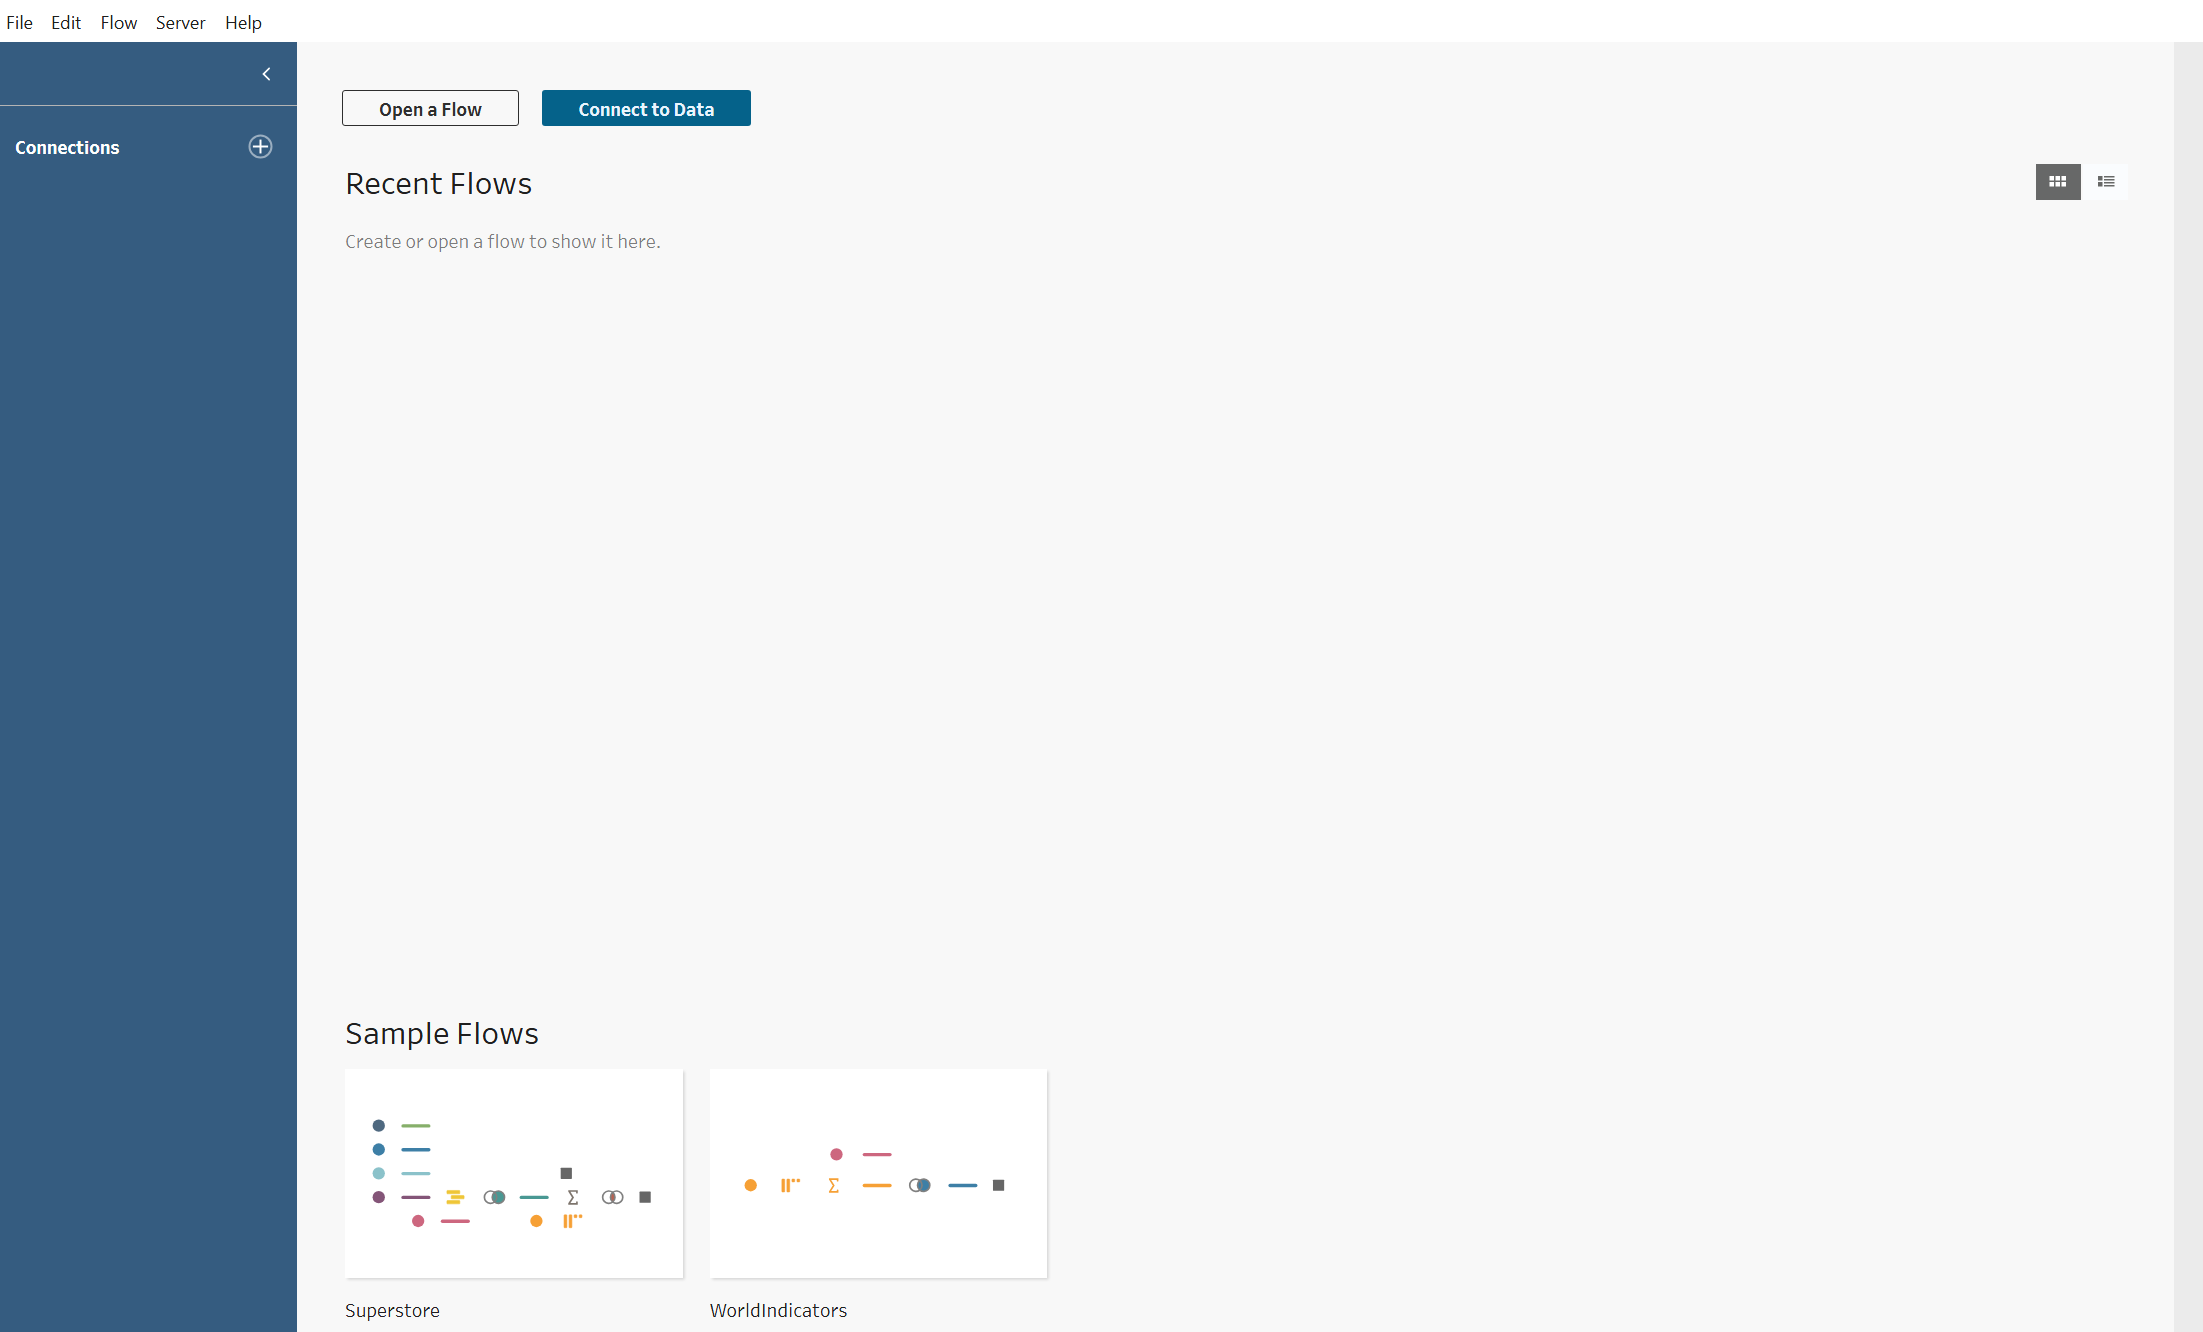
- Connections Pane (left side): Where every data source you bring in lives. You'll come back here anytime you want to add more.
- Flow Pane (center): The canvas where your flow lives. Each step you add shows up as a box, connected left to right, so you can follow exactly what happened to the data from start to finish.
- Profile Pane: Click any step and this updates to show a summary of every field, including a bar chart of value distributions. This is where you spot problems before opening a single row.
- Data Grid: The row-level detail underneath. If the Profile Pane flags something, this is where you confirm which rows it's actually coming from.
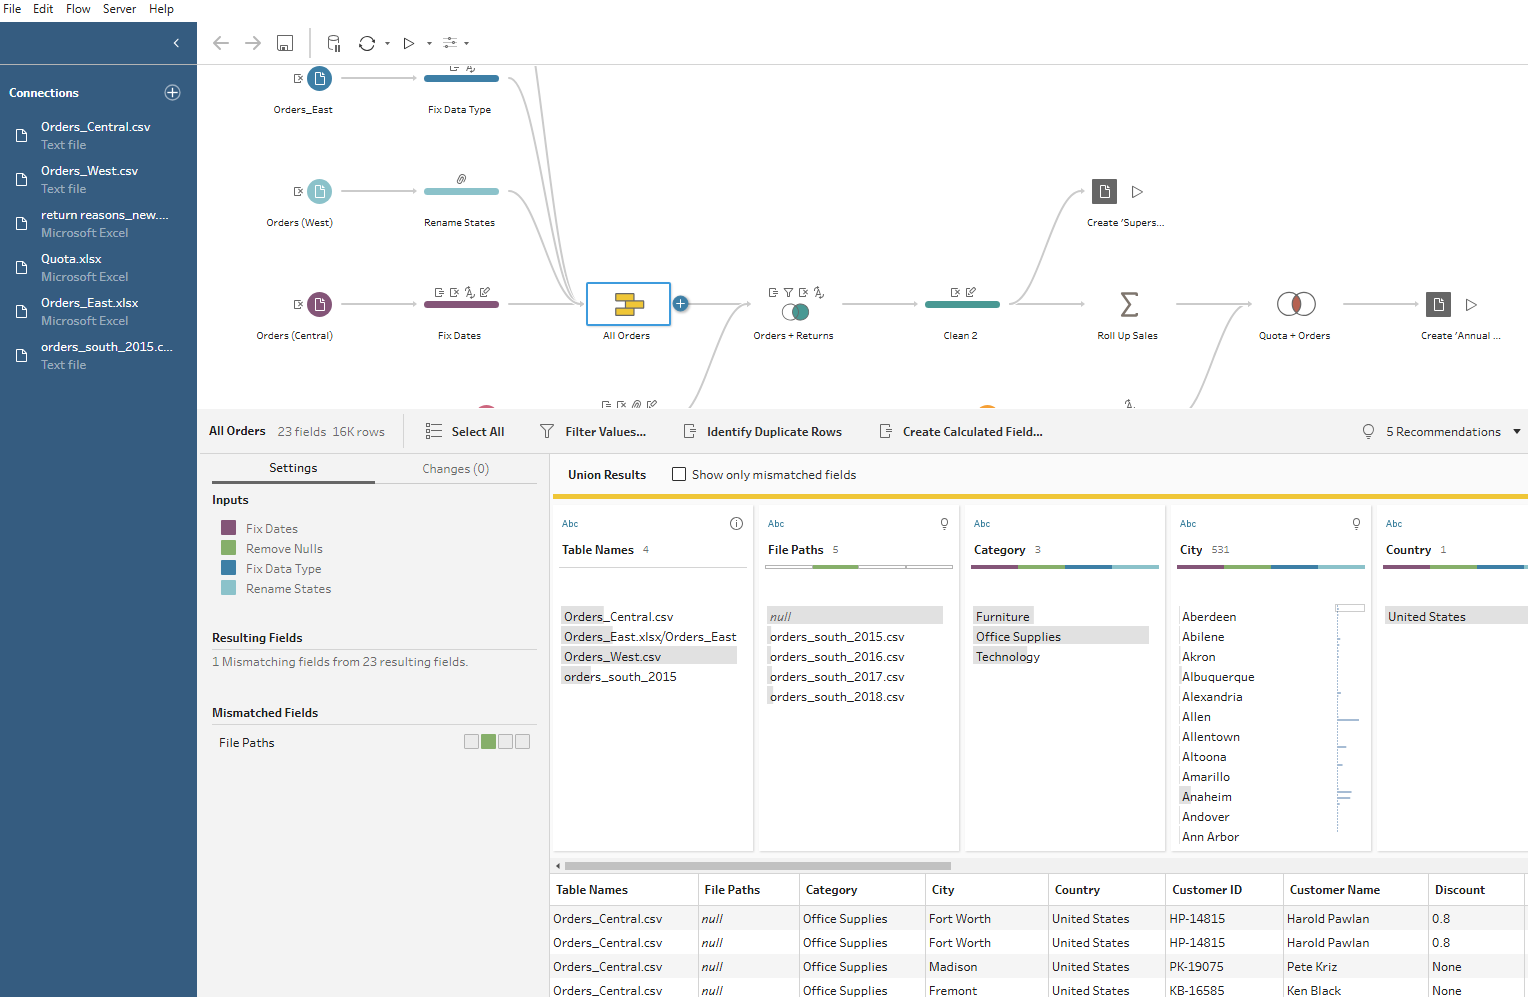
Before you clean anything, spend a minute in the Profile Pane. It'll usually show you where the problems are before you've touched a single field.
Connecting Your Data
Click the plus icon in the Connections Pane and choose your source: text file, Excel workbook, database, or something already published to Tableau Server. Once connected, drag it into the Flow Pane and it becomes your first step.
The Steps
| Step | What it does |
|---|---|
| Clean | Fix values, rename fields, change data types, split fields, remove columns |
| New Rows | Fills gaps in sequential date or numeric data so you get a continuous series |
| Pivot | Reshapes data, turning columns into rows or rows into columns |
| Aggregate | Summarizes data into groups: totals, averages, counts |
| Join | Combines two datasets side by side, matched on a shared field |
| Union | Stacks two datasets on top of each other, adding rows instead of columns |
| Output | Saves your cleaned data to a CSV, Hyper file, or Tableau Server |
Inside a Clean step, the common tasks are:
- Rename a field: Double-click the field name and type the new one
- Change a data type: Click the icon next to the field name and pick the correct type
- Split a field: Right-click and choose Split Values (Prep auto-detects the delimiter, or you can set your own)
- Fix or replace a value: Click a value in the Profile Pane's bar chart to edit, group, or exclude it
- Remove a field: Three-dot menu, select Remove
- Handle nulls: Filter them out or replace with a calculated field
- Remove duplicates: Three-dot menu, Clean, then Remove Duplicate Rows
Document as You Go
Every step in Prep can be renamed, and every step can also carry a written description. Get in the habit of using both.
Renaming matters because the default step names tell you nothing. "Clean 3" doesn't say what it does. "Fix Region Values" does. Six months from now, or when someone else opens your flow, the names are the only thing telling anyone what happened without clicking into each step one by one.
Descriptions matter for a different reason. A step name can tell you what happened, but not why. If Postal Code needs to be a string instead of a number, or Region needs to be limited to four directions, that's context that won't be obvious just from looking at the data. Writing a short note on the step, even just a sentence, saves whoever picks up the flow next from having to guess your reasoning or ask you directly.
This adds up fast in a flow with ten or fifteen steps. Without documentation, someone has to click through every single one to understand what's going on. With it, they can scan the flow top to bottom and follow the logic without opening a thing.
It's a small habit, but it's the difference between a flow only you can maintain and one anyone on your team can pick up.
Where to Practice
Preppin Data has hundreds of free challenges at every skill level, built around Tableau Prep specifically. It's a resource I highly encourage for anyone trying to get into Prep!