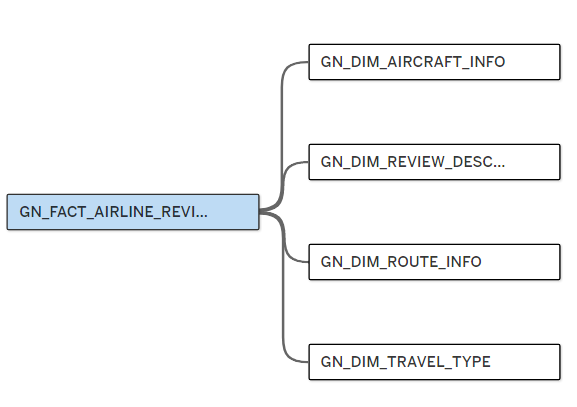
This project asked us to pick a real dataset, model it into fact and dimension tables, load it into Snowflake, and eventually publish it as a Tableau data source, with a user story driving the decisions along the way. I landed on airline review data from Kaggle after remembering an upcoming trip, and built the schema around a customer relations agent trying to understand how customers are engaging with the airline's service. I mapped every column in Excalidraw looking for natural groupings, then used Tableau Prep to confirm the granularity: one row per unique customer review. My first instinct was to split aggressively, dates in their own table, big text fields isolated, tables carved out by use case, until a conversation with Megan reset that. She reminded me not to build tables for the sake of it, and we agreed a scaffolded date table was a neat idea that didn't fit this project's scope. I kept review title and review text together in one table instead, since that's the block worth revisiting later with AI-assisted text analysis.
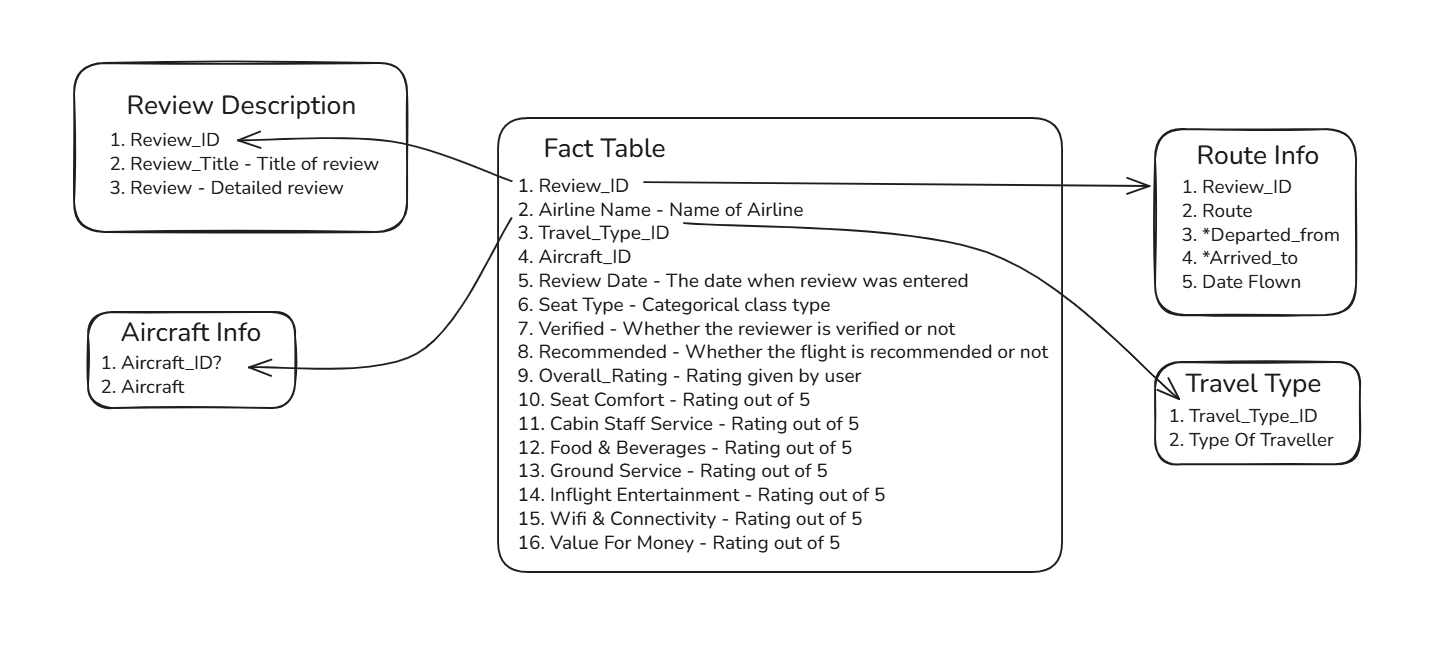
The real blocker was splitting further with no reviewer or airline-level key to lean on. Talking it through with Nathan helped, he pointed out that the missing unique identifiers were exactly what made the dataset tricky, and that I needed to keep unique dimensions in view alongside the measures rather than defaulting to one. That's what led to the aircraft table (with its own surrogate key, expandable later into manufacturer and model) and the route table. Tableau Prep handled the cleanup: fixing the aircraft column, splitting route into departed_from and arrived_to, renaming columns to SQL standards, generating review IDs, and converting recommended to a boolean. Snowflake itself was its own fight. I'd forgotten the process, tried creating a file format and stage first, and hit a permissions wall, so I loaded through the ingestion tab instead. From there I built each dimension table with an auto-incrementing key and an insert pulling distinct values off the source, then built the fact table last by pulling those surrogate keys back in.

The lesson wasn't technical, it was restraint: it's easy to keep splitting a dataset because you can, not because the model needs it. The harder lesson was that missing identifiers aren't a dead end, just a reason to be more deliberate about which dimensions earn their own table, and to keep the user story in view so those calls stay tied to a real question. Talking to my fellow consultants at the right moments kept me from either over-building or getting stuck.