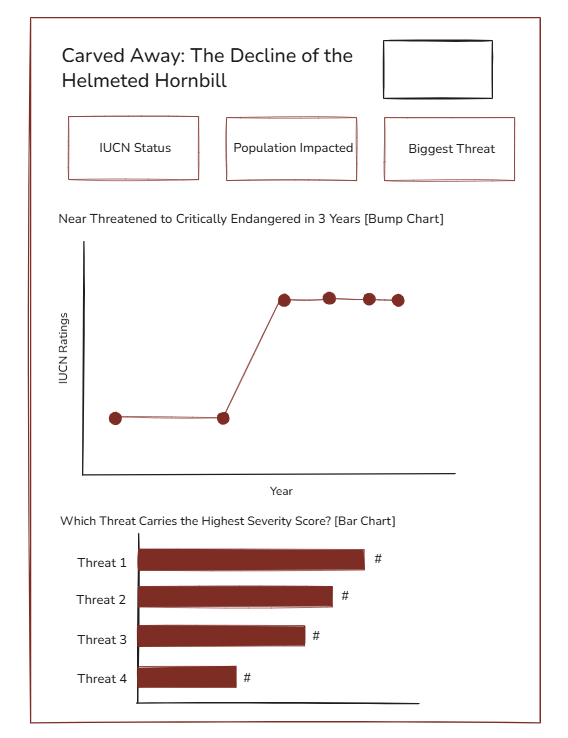
Day 4 of dashboard week, and today we were tasked to build an infographic using IUCN API data. I decided to focus on the Helmeted Hornbill- a species whose IUCN conservation score unfortunately jumped from nearly threatened to critically endangered between 2012 and 2015. The main software used today was Alteryx where I unnested and flattened a lot of the files that appeared within the API.
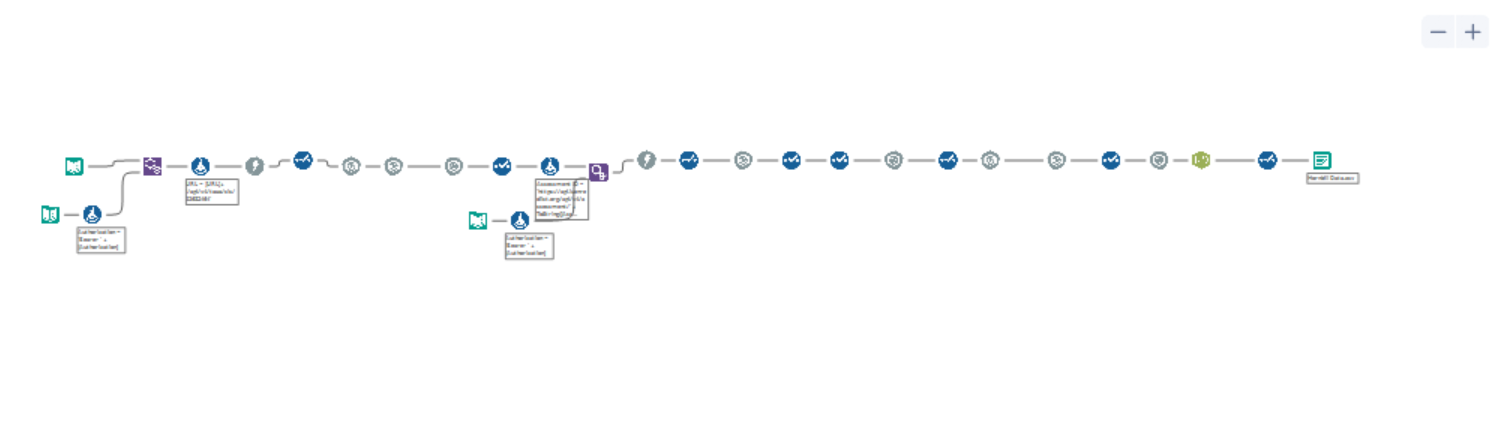
The biggest challenge today was the nature of the data. I anticipated there to be more quantitative metrics; however after a few hours of parsing through the API, most of the data were string values. This project really tested my ability to pivot and use the data available to create a meaningful and informative visual.
We’re unable to post our infographic, but here is a sketch: