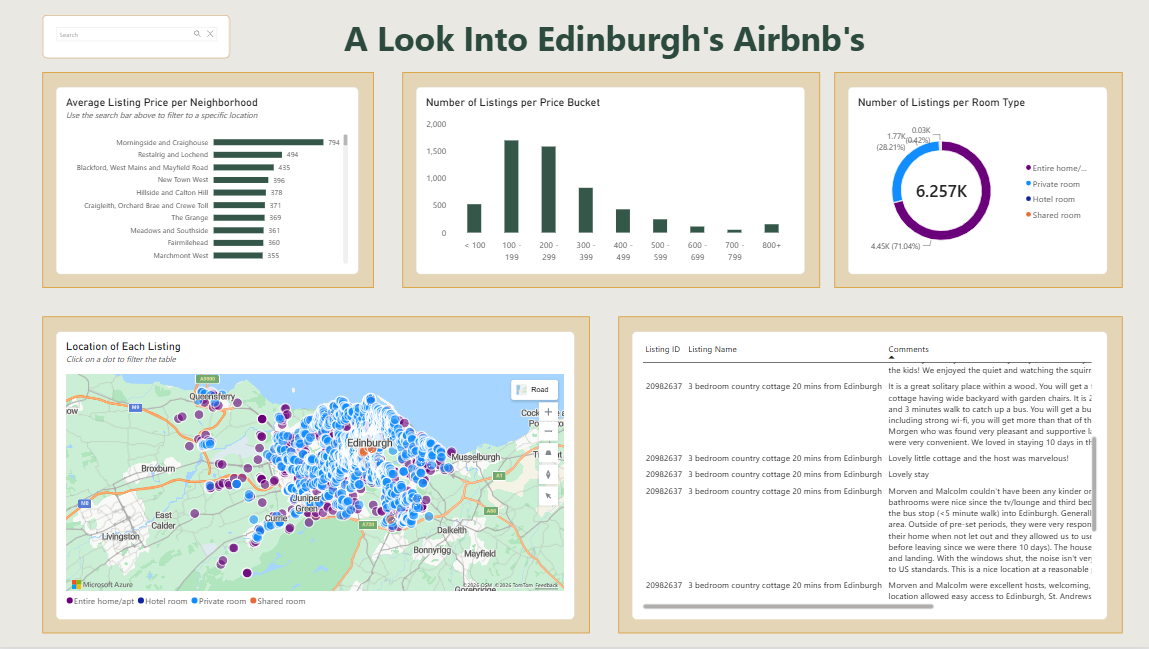
On day 2, our task was to build a Power BI dashboard using Airbnb data from the following website:
https://insideairbnb.com/get-the-data/
We were given the freedom to choose our own city, and for this project, I chose Edinburgh.
I spent the first hour exploring the data and sketching. As someone who enjoys traveling, after looking at the data I knew that I wanted to build an exploratory dashboard. This dashboard would allow users to analyze: average listing prices per neighborhood, listing volumes across price buckets, a breakdown of room types, and finally, an interactive map where you can explore listings and their reviews.
The main challenge of the day occurred during the data preparation step. I assumed that listing_id was a unique value in the listings table, however this was not the case.
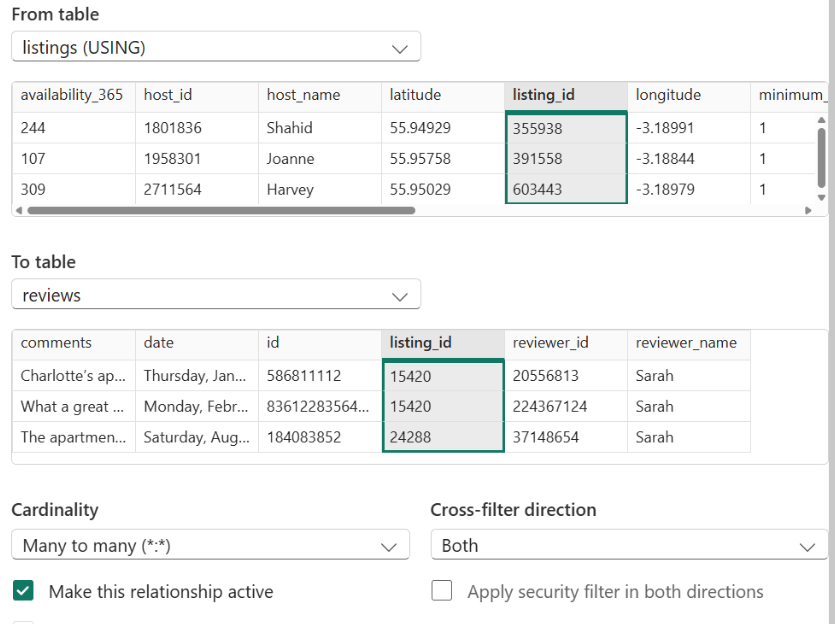
To solve this issue I created a unique id concatenating listing_id, longitude, latitude, and listing name within all tables. I then created a data model using that unique id.
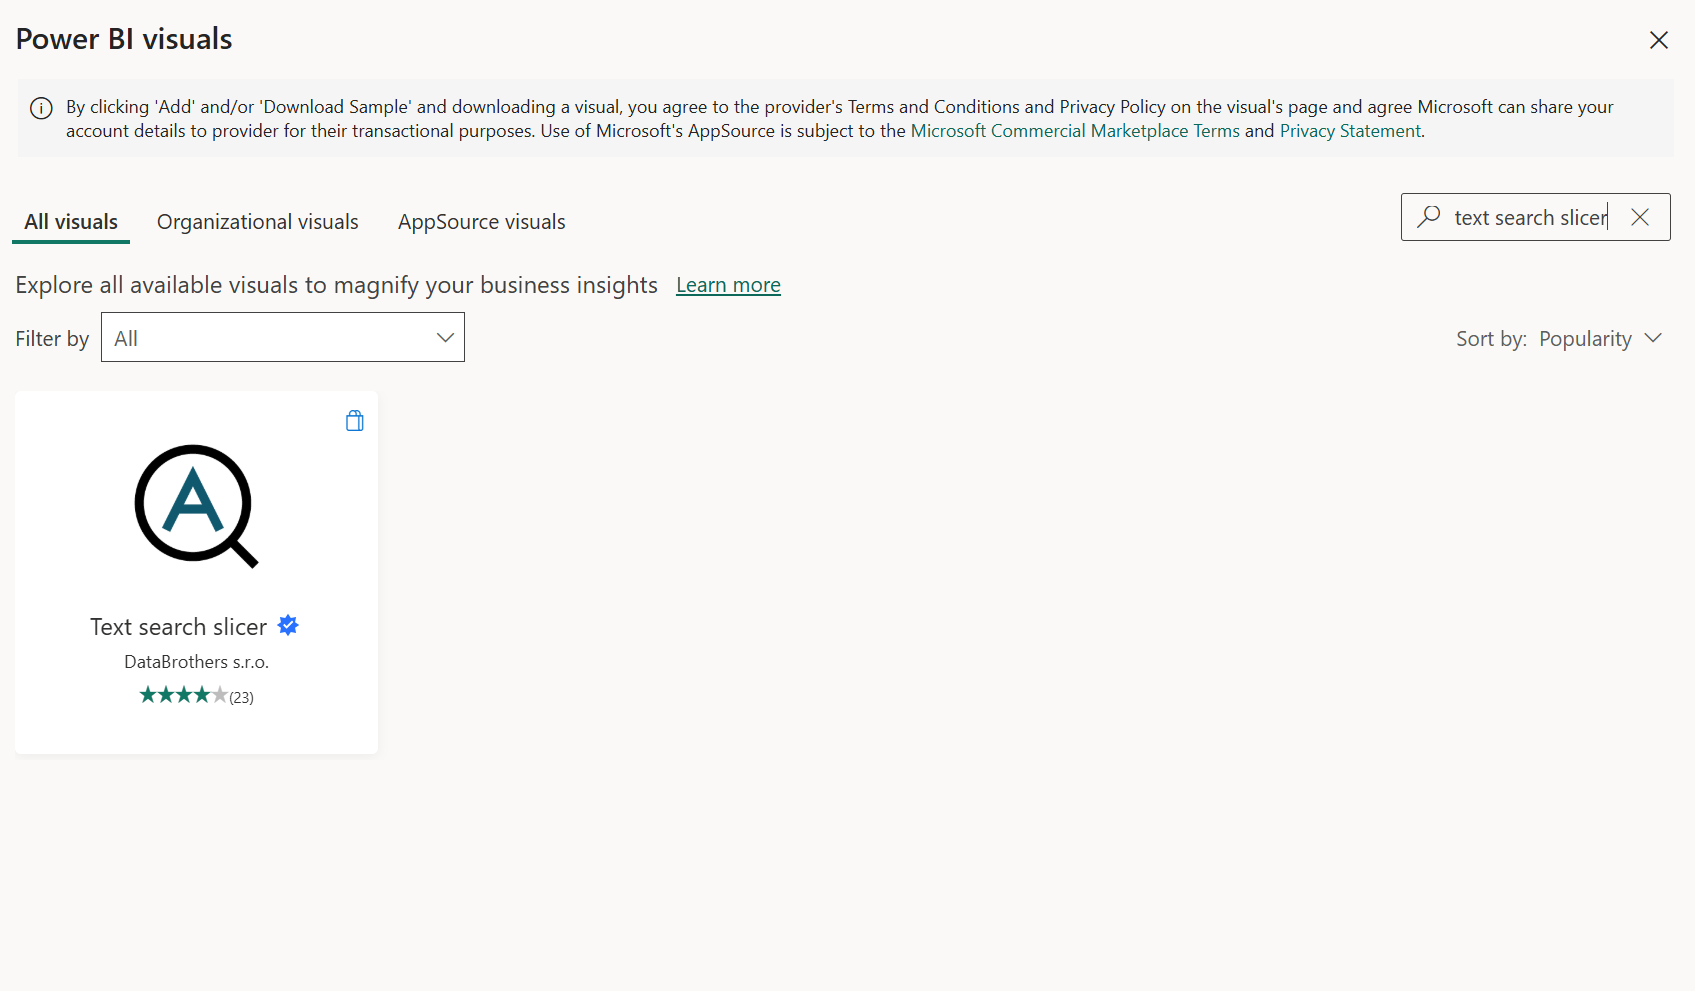
A highlight today was an add-in app in Power BI called “Text Search Slicer”. This slicer allows you to search and filter words quickly if you have a chart with many values. For my dashboard, users can use this application to search for a particular neighborhood in Edinburgh.
If curious, here’s a look of my final dashboard: