


When building Tableau dashboards, it’s easy to inadvertently introduce elements that drag down performance. While the Workbook Optimizer is an excellent first step for troubleshooting, complex issues often require a deeper dive into the backend. That’s where Performance Recordings come in. These built-in diagnostic tools pinpoint exactly where your technical bottlenecks lie. However, making sense of the resulting performance workbook can be daunting. Let’s use this visual to break down exactly where to start.
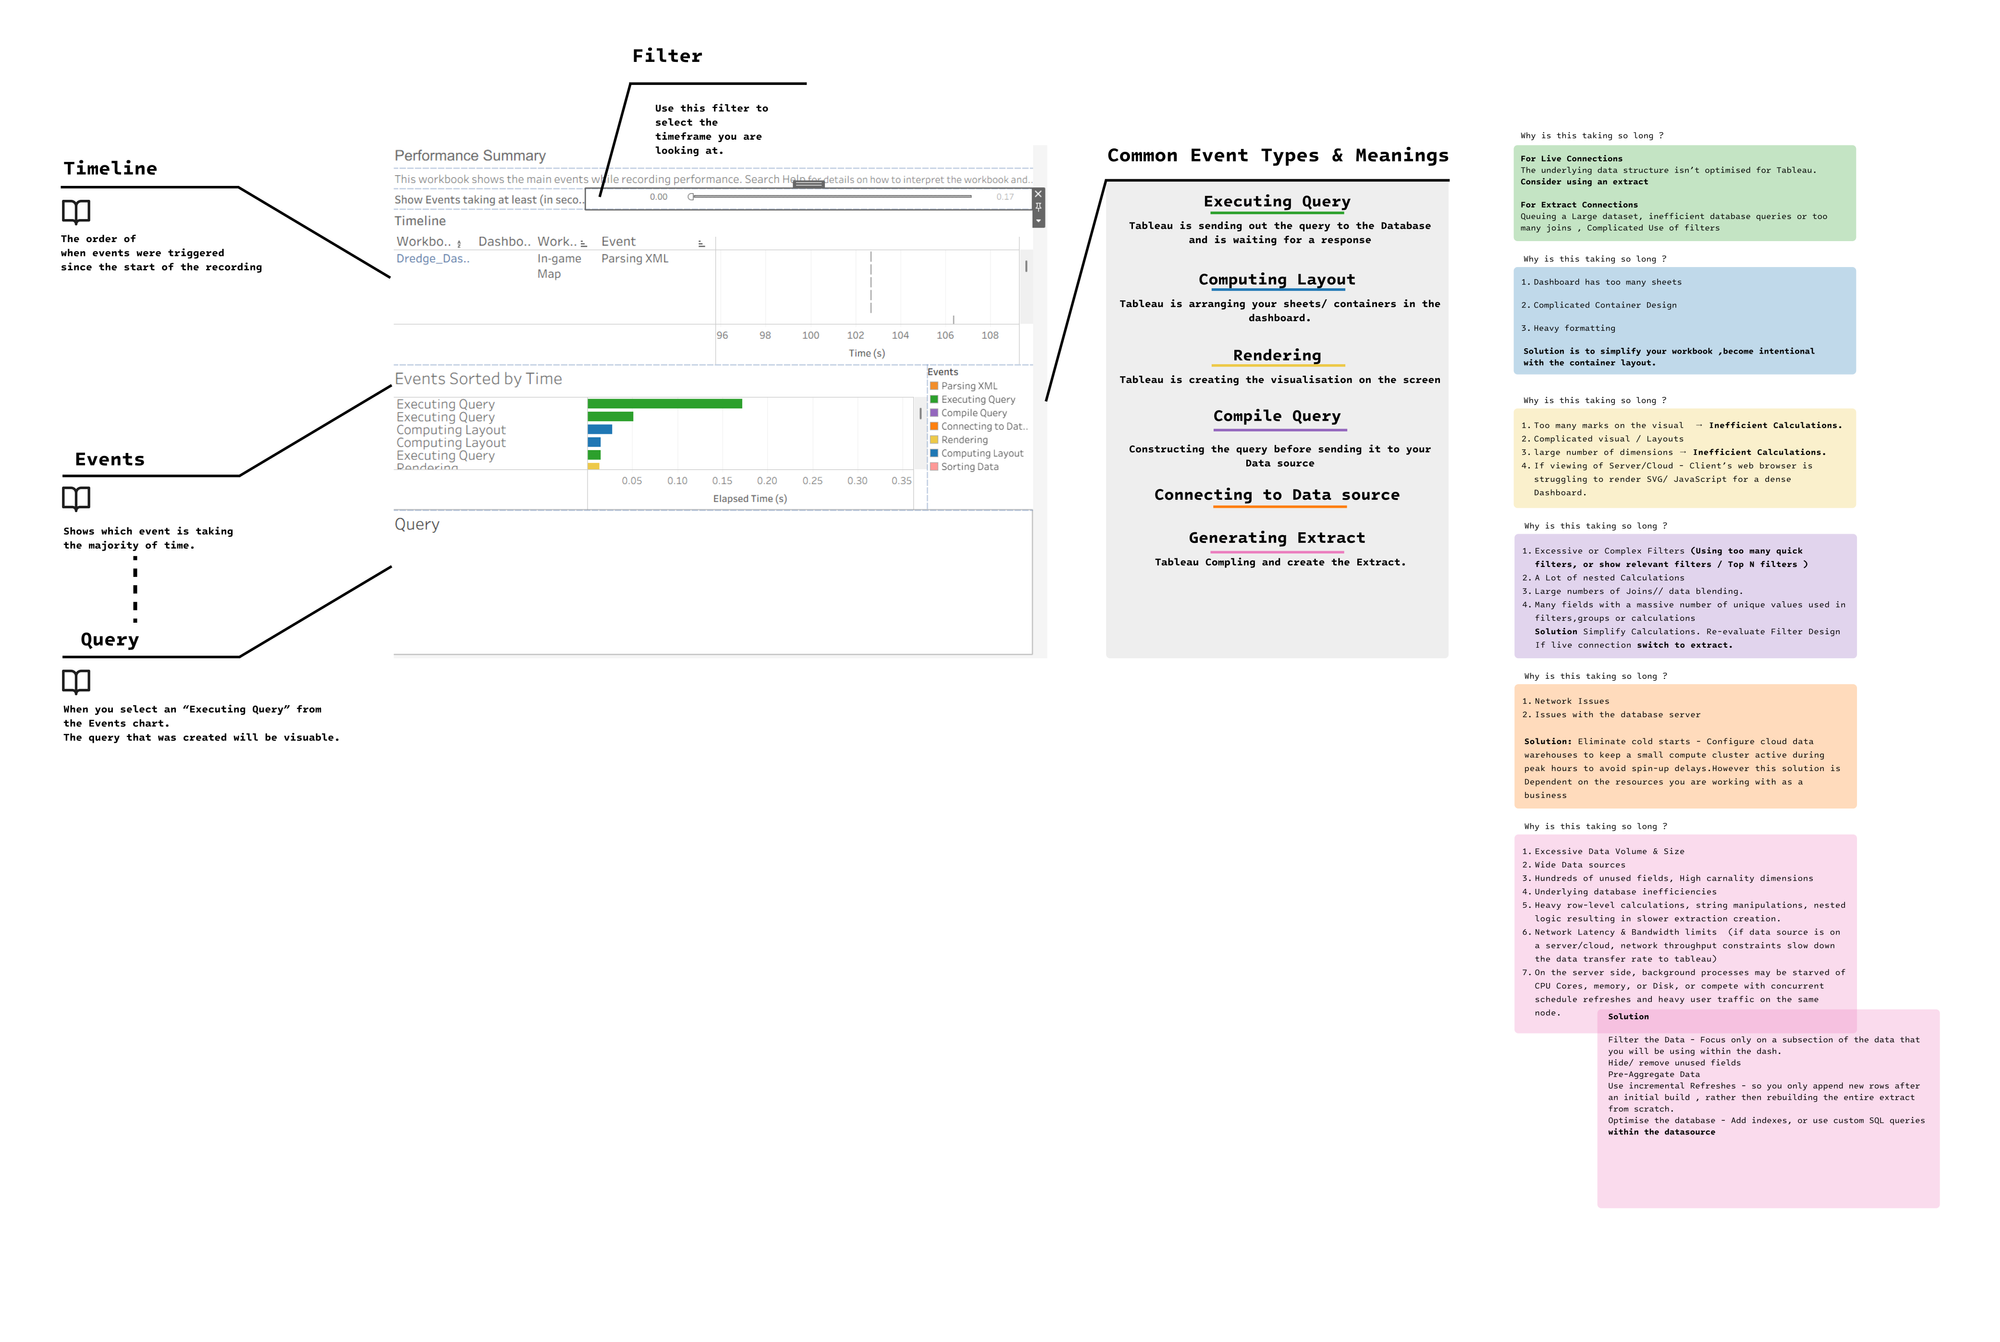
This visual is designed to help you navigate the Performance Summary view of your Performance Recordings. It breaks down the layout, explains what each chart represents, and highlights common event types you might encounter and some recommendations on how to solve them.
Hope this helps!