Part 1: "Order of Operations"
Why Following the Order of Operations in Tableau matters and what happens when you ignore the order of operations? Chaos!
I did some research and found a helpful YouTube video from "Tableau Tim" ( about fixed LODs). However, Tim recommended right at the beginning that you need to understand two other topics in detail beforehand: "Order of Operations" (*Link: https://www.youtube.com/watch?v=KbKSzD3okrQ) and "Understanding Granularity".
The first thing I learned is that the order of operations in Tableau is ultimately the same as the mathematical order of operations.
PEMDAS
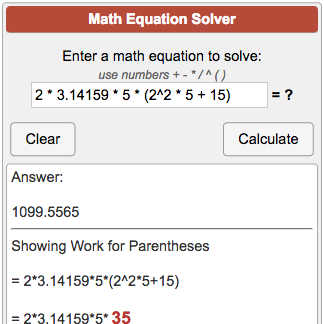
, or "Please Excuse My Dear Aunt Sally," is an acronym used to remember the order of operations (Link: https://www.calculatorsoup.com/calculators/math/math-equation-solver.php#warning) in mathematics:
- Parentheses: Perform operations inside parentheses first.
- Exponents: Evaluate expressions with exponents next.
- Multiplication: Multiply before performing division.
- Division: Perform division after multiplication.
- Addition: Add after multiplication and division.
- Subtraction: Subtract after multiplication, division, and addition.
This order ensures that mathematical expressions are evaluated consistently and accurately. If PEMDAS is not followed, this can lead to incorrect results. Same applies to Tableau but looks slightly different:
Order of Operations
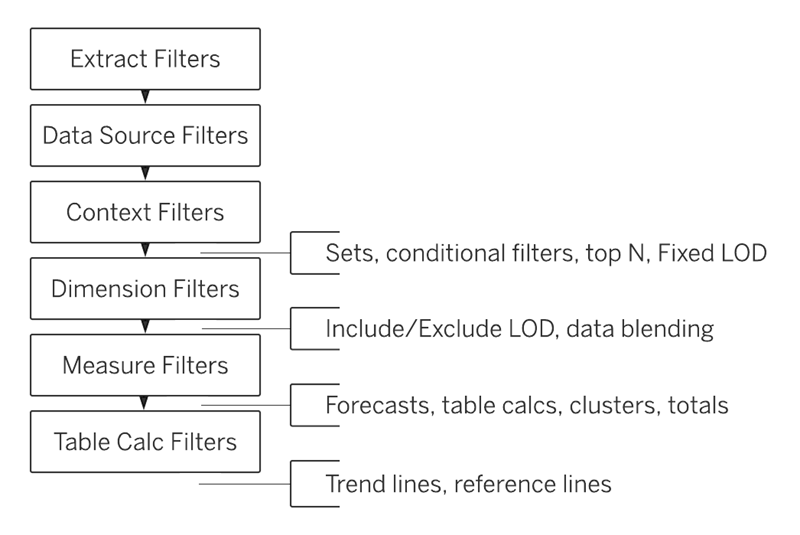
I followed Tableau Tim's advice and checked the Tableau help page for further details. The most important thing I found was the following illustration (*Source Link: Tableau's Order of Operations - Tableau), which shows the order of operations:
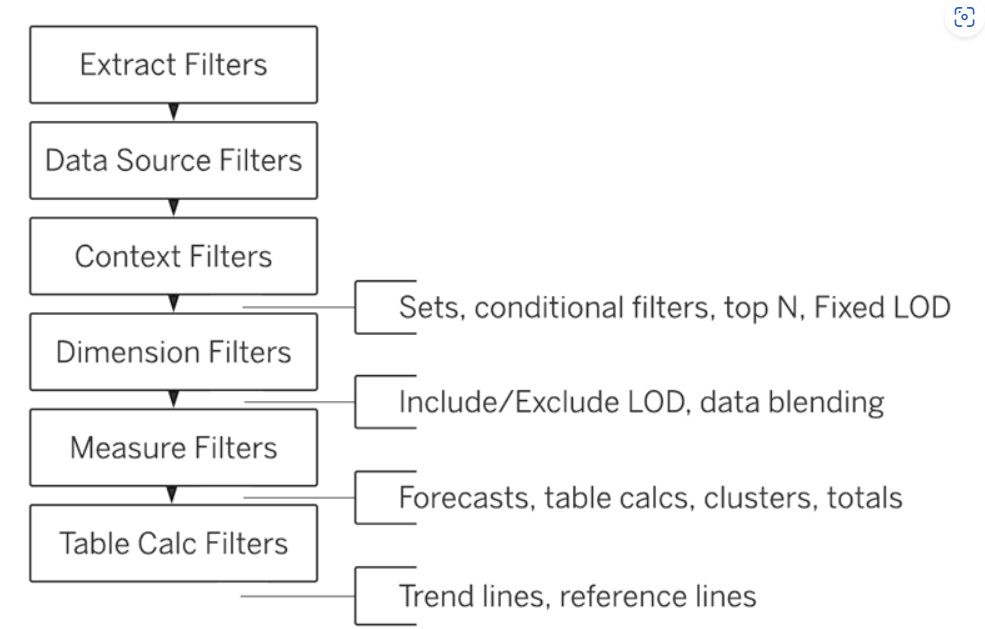
Here is my summary of the above scheme including examples:
Extract Filters:
- Definition: Extract filters are applied to extracted data to reduce the amount of data stored in the Tableau extract.
- Example: You create an extract of your sales data for the year 2020. Using an extract filter, you can retain data for only a specific time period, such as the fourth quarter.
Data Source Filters:
- Definition: Data source filters are applied to the entire data source before the data is loaded into Tableau.
- Example: You want to analyze data for customers in a specific country only. By applying a data source filter, you can filter out all records that do not belong to that country.
Context Filters:
- Definition: Context filters are evaluated before other filters in the data model and can influence the filter order.
- Example: You have set a context filter for the year 2020. This filter will be applied first before other filters, such as for products or regions, are applied.
Dimension Filters:
- Definition: Dimension filters are applied to dimensions and allow filtering data based on the values in the dimensions.
- Example: You want to display data for specific product categories only. A dimension filter allows you to select only the relevant categories.
Measure Filters:
- Definition: Measure filters are applied to aggregated values and allow filtering data based on the aggregated measure values.
- Example: You want to display only sales data where revenue is above a certain threshold. A measure filter allows you to filter the records based on revenue.
Table Calc Filters:
- Definition: Tableau calculation filters are applicable to aggregated values and allow filtering data based on calculation results.
- Example: You want to display only rows where the relative sales growth is above a certain value. A calculation filter allows you to filter the data based on this calculation.
But why all this? Tableau Tim uses a simple example of the consequences with the SuperStore dataset to explain differences. I reproduced this also directly in Tableau desktop and show you my screenshots below:
Sorting
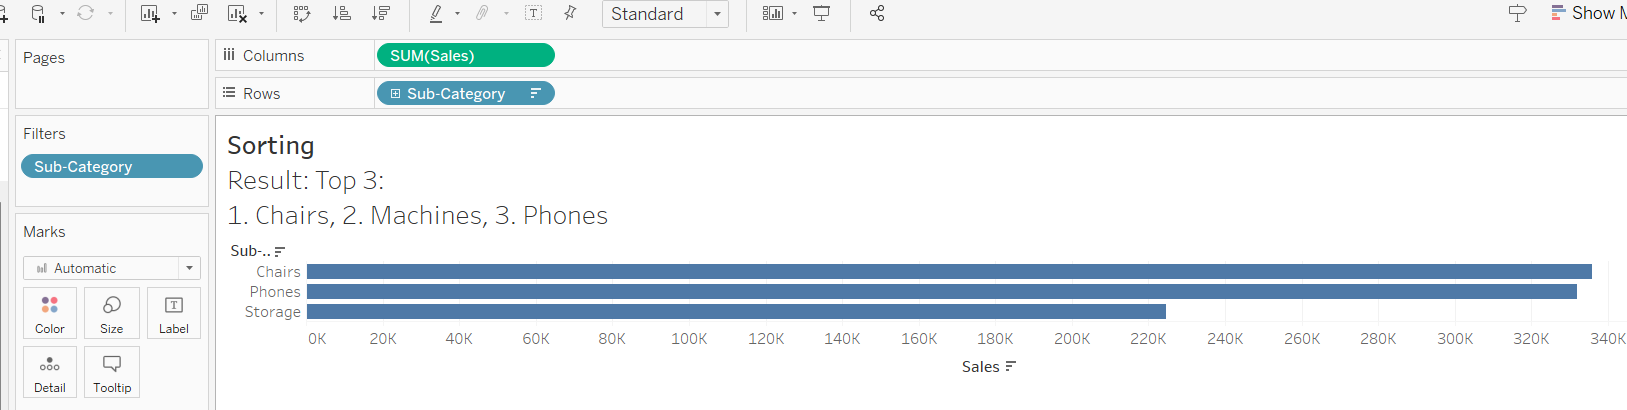
Here you can see that the following Sub-Categories are the most successful. Result: 1. Chairs, 2. Machines, 3. Phones
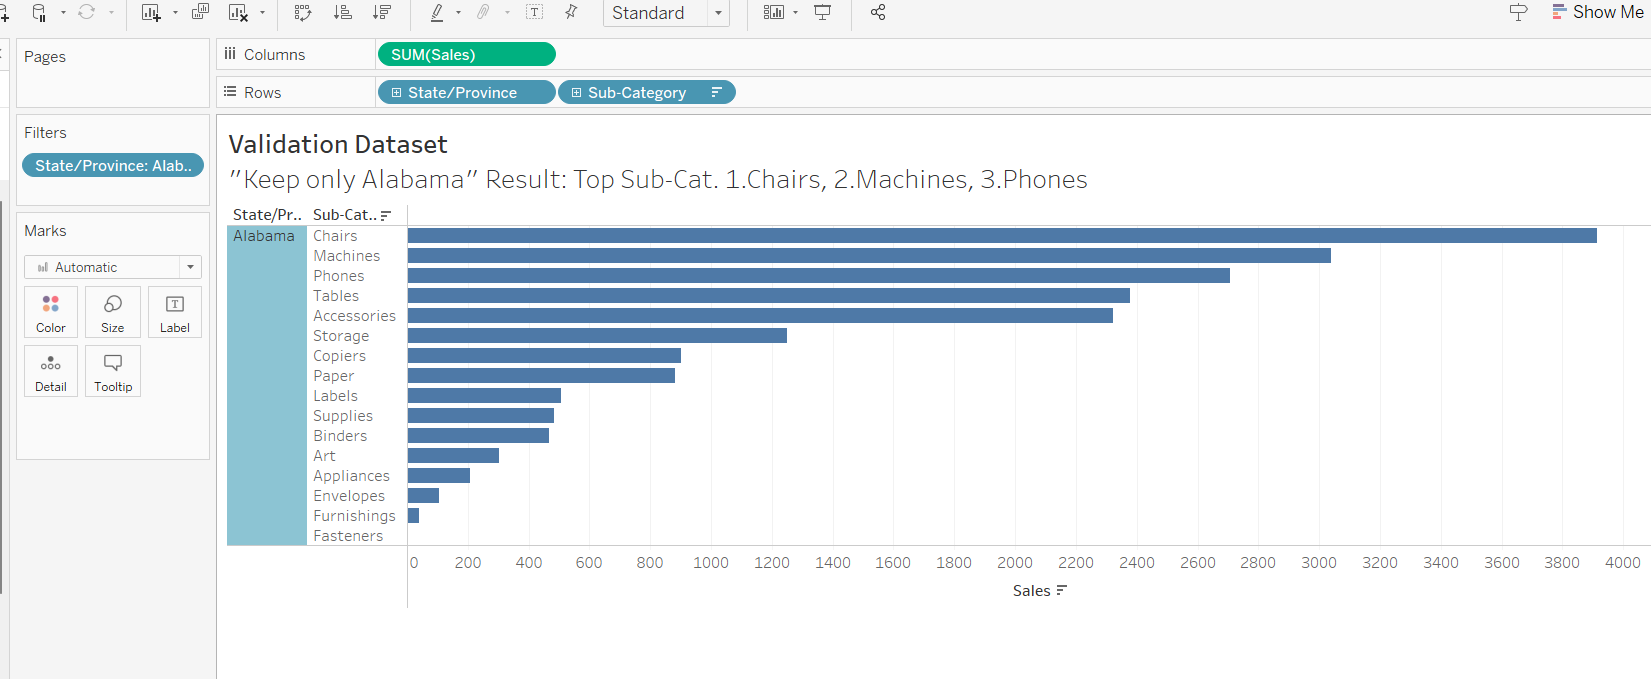
State to Rows
Adding States to the Filter and choosing Alabama you can see that the following Sub-Categories are the most successful. Result: 1. Chairs, 2. Phones, 3. Storage
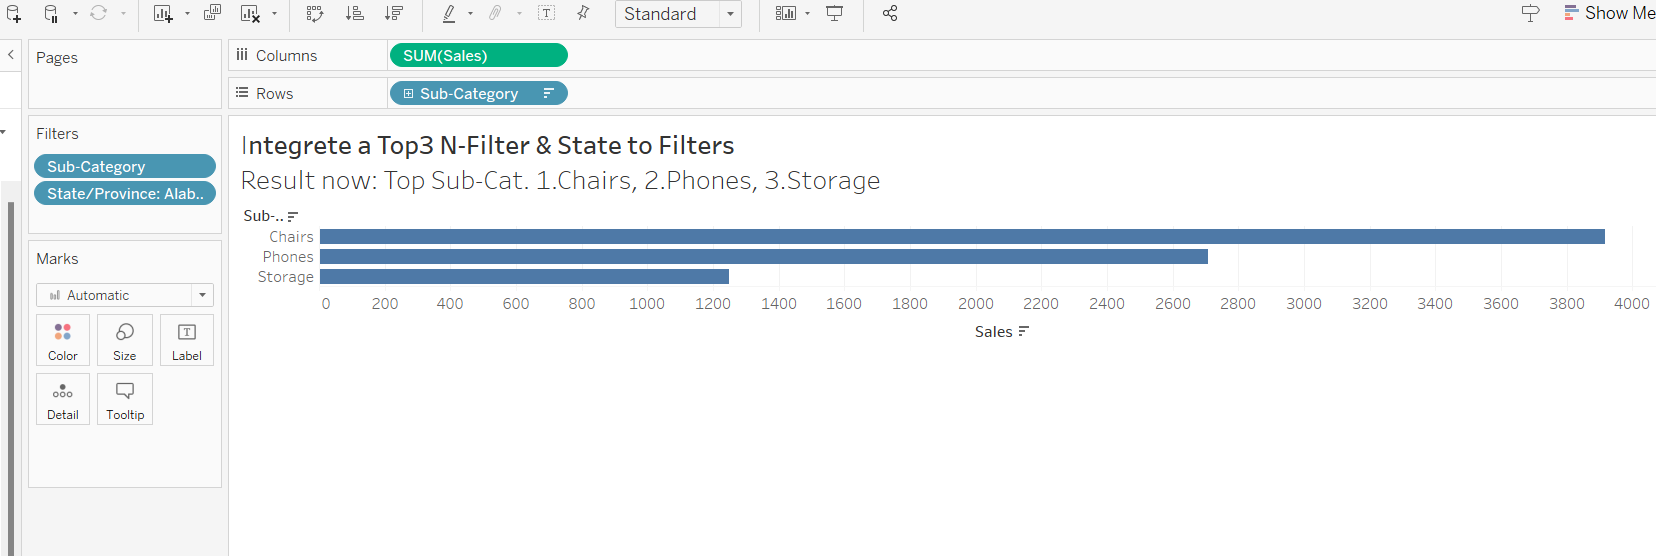
Top 3 N-Filter
Adding States to the Top 3 N-Filter and choosing Alabama you can see that the following Sub-Categories are the most successful. Result: 1. Chairs, 2. Machines, 3. Storage
Data Source Filter
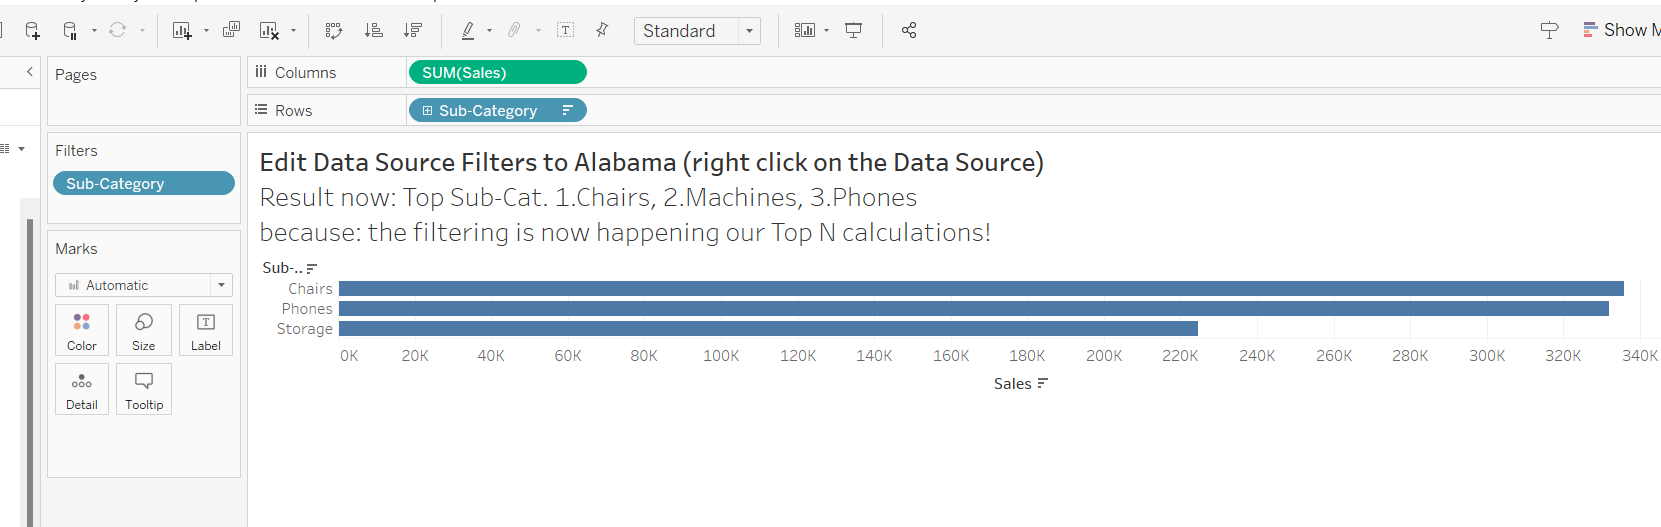
Adding Alabama to the Data Source Filter you can see that the following Sub-Categories are the most successful. Result: 1. Chairs, 2. Phones, 3. Storage
Context Filter
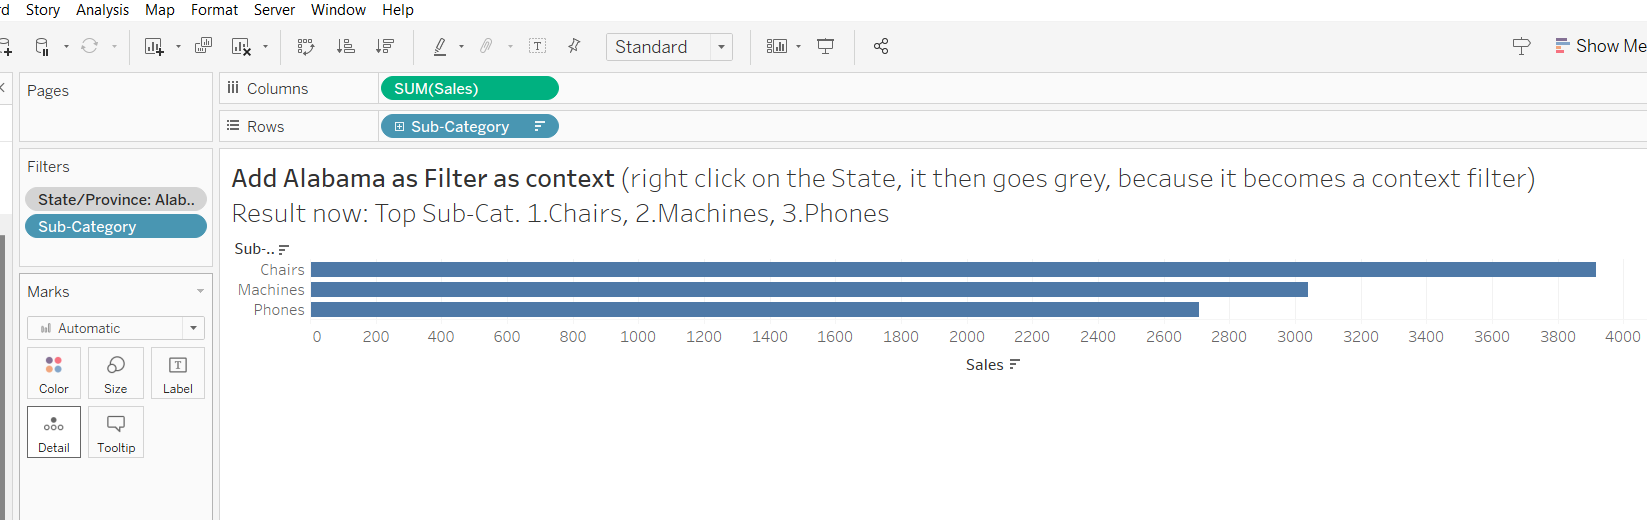
Adding Alabama to the Context Filter (it turns grey) you can see that the following Sub-Categories are the most successful. Result: 1. Chairs, 2. Machines, 3. Phones
Summary
Picture this: you're crafting a dashboard but something went wrong? Here's the thing: Tableau follows a strict order of operations. Ignoring this results in having analytical problems. If you apply a filter before aggregating your data, it's like putting the cart before the horse. Filters override calculations, calculations override sorts, and your dashboard becomes a tangled mess of contradictions.
Remember: PEMDAS isn't just for math class!
Interesting Sources