
Recently, I have had an inner debate about the impartiality of data. In the field of data science, the accuracy and impartiality of data are paramount to insure accurate and unbiased decision-making. Scientists, historians, sociologists, and CEOs are all aware of the importance of impartiality in Data, and they do everything they can to prevent it from ruining their work. The burden of impartiality also falls on the Data scientist that is responsible for communicating data through graphs and visual representations. Since February, I too have felt that responsibility, and at first, I thought it possible to cast away the shadows of impartiality by carefully following best practices. This was until I came across this visualization by Simon Scarr:
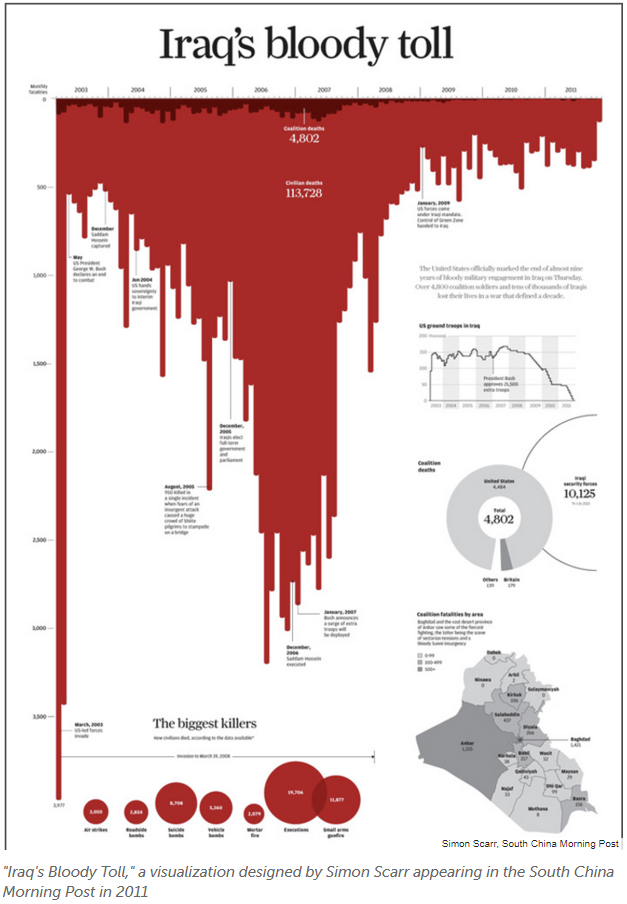
This striking visualization resonated with me at a level no data ever had. The bloody inverted bar graph leaking on the sheet conveyed the horror of war and pushed me to learn more about the atrocities that had happened in Iraq. A week after first seeing this dashboard, I was still thinking about it and then another thought crossed my mind. What if Simon Scarr had followed the rule books? What if instead of an inverted bar graph, he had used a line graph to show the evolution of casualties in the Iraq War? What if he had been impartial in the way he presented that data? Would it have made it a better or worst visualization?
As that internal debate was raging in my head, I thought of a quote I had heard a while ago. Josef Stalin once said, "The death of one man is a tragedy. The death of millions is a statistic.". I always hated that quote. How could the death of millions be nothing more than a statistic? How could we forget that a million death is also a million tragedies? At that moment, I realized what Simon Scarr had done through his unconventional visualization. He had given a voice to the masses. He had turned a statistic into a story that people were compelled to hear, and he influenced people to enact change so that horrors such as the Iraq war would not be left unnoticed, at the margins of history.
Feeling good about finally proving Stalin wrong, I did what any other aspiring data scientist with an appetite for learning would do and completely ripped off Simon Scarr's dashboard design to make my own visualization of Russia's bloody War in Ukraine.
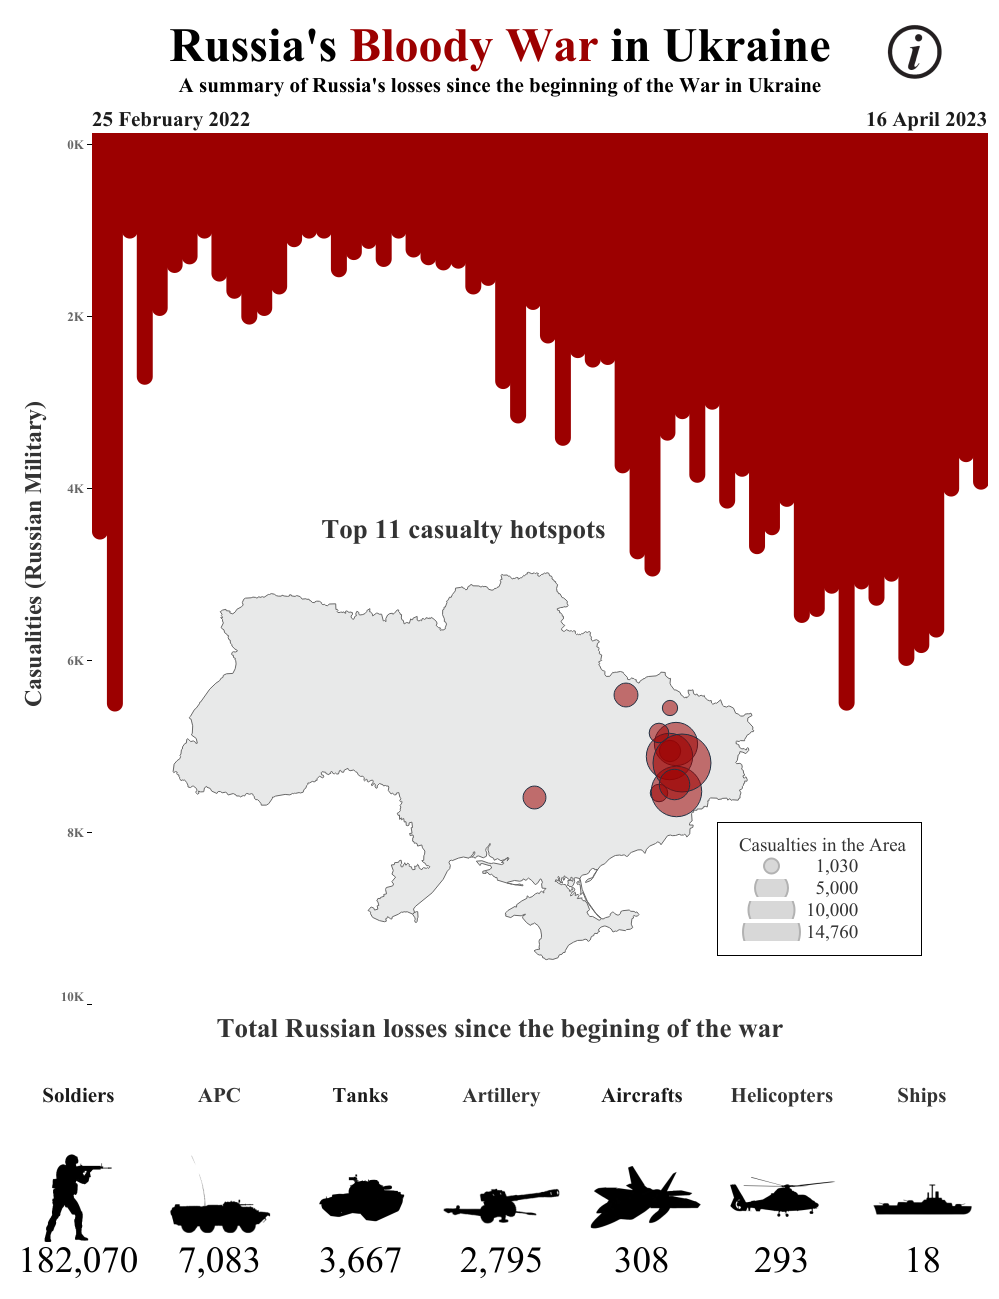
This dashboard is far from unbiased as I built it to shine a light on the scale and horror of the Ukraine War. The data presented in this dashboard should also be considered carefully as it was issued by the Armed Forces of Ukraine and is in no way unbiased nor necessarily accurate. I believe that as data scientists, it is our responsibility to communicate data honestly and accurately. For data to be impactful, it has to tell a story. It is hence our duty to tell that story, even when that means bending the rules of impartial data representation.