


With training coming to a close, it’s time for our much anticipated dashboard week! For day one, I was tasked with analysing Chelsea FC’s Performance Insights, part of the CFC Performance Insights Vizathon held recently. Power BI Desktop had to be used to deliver our final analysis, using Alteryx and/or Power Query for data prep.
Step 1: Explore the Data
 Chelsea-Fc-Performance-Insights
Given the time I had to produce this, I decided to start by exploring the data and pinpointing a specific area of focus. I decided that the GPS data provided would be the best in terms of focus area, as this had detailed information on Heart Rate, Acceleration, Distance covered for both training and matches. The idea was to give the user the ability to quickly identify potential underperformance in certain matches, and then be able to see if this was due to similar performances in training sessions leading up to that specific match.
Step 2: Data Prep
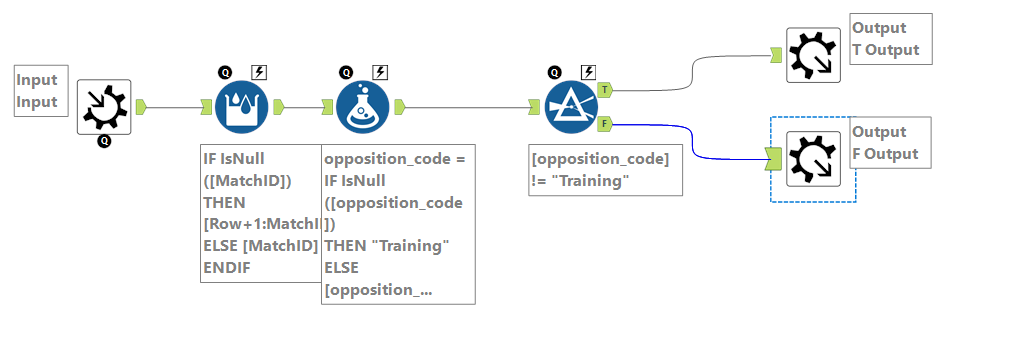
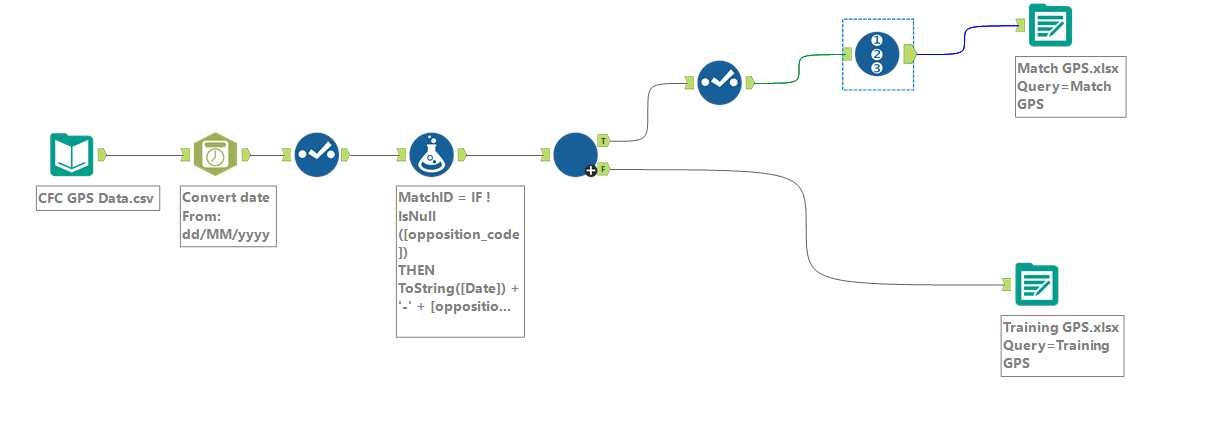
The initial plan was to quickly be able to split out training sessions and matches, and then relate them back together, but I realised that I needed to give each match a unique identifier and apply that to a training session. This was to avoid issues due to Chelsea playing a team multiple times in a season, and ensuring that training sessions were linked to the correct matches. To do this, I created an iterative macro in Alteryx that would run until my newly created Match-ID column was populated for all training sessions, and then automatically split matches and training.
This proved to be much more challenging than I anticipated, and took up most of my time, so I decided to steer away from creating a sketch which was my initial plan, and get to building.
Step 3: Data Model
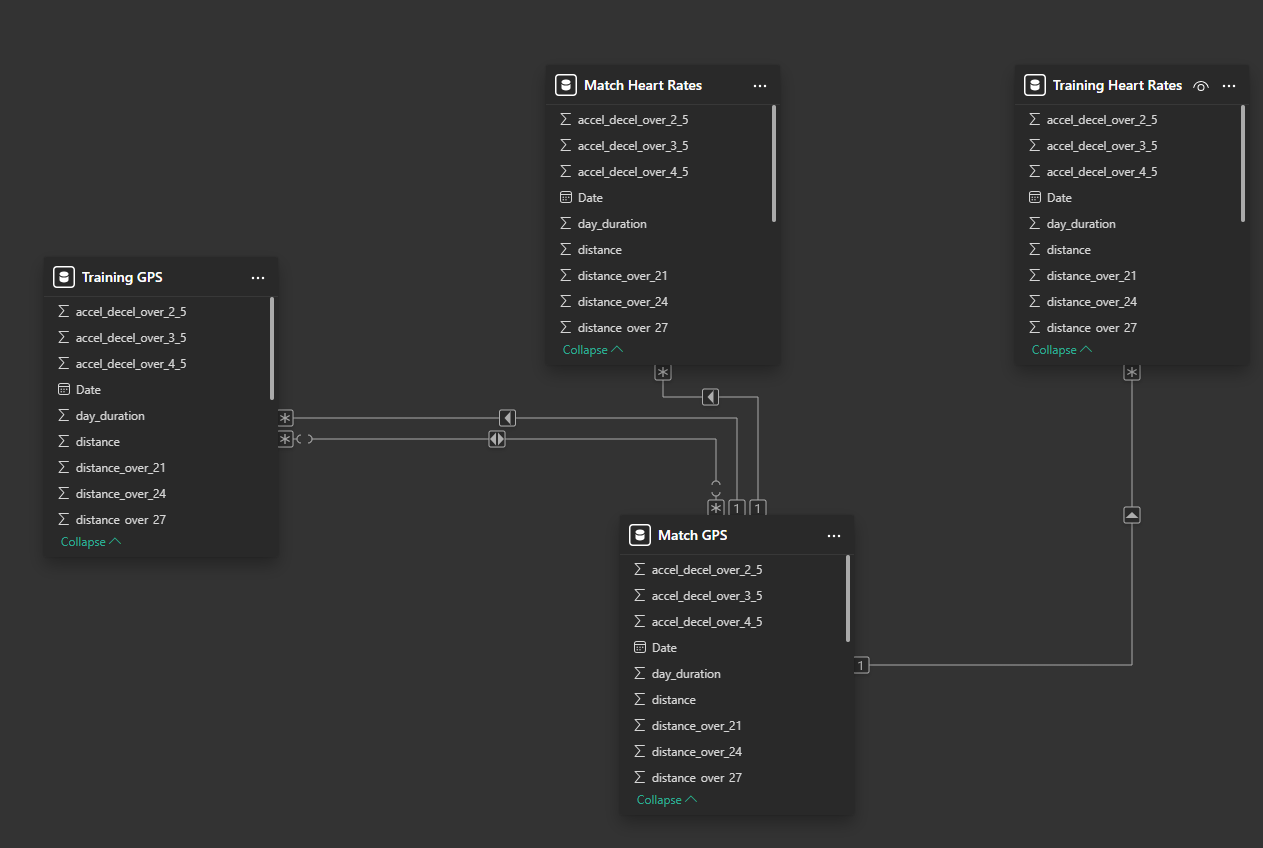
Upon linking my Match and Training files in Power BI, when experimenting with creating some charts, I quickly realised that to analyse Time Spent in specific Heart Rate Zones, I needed to pivot the data. However, this would result in duplication of training sessions and matches, so I duplicated both of my Training and Match files, pivoted the data in those new tables, and then related them back to each other, specifically using these to pull in Heart Rate data only. I related all tables using the Match ID field I created in Alteryx.
Step 4: Compiling a Dashboard
The first things that are intended to grab a user’s (in this case a Coach) attention is the Season and Match Filters. Everything, including the KPIs is filtered based on those selections (giving the ability to also look at all matches). I decided to use Distance Covered as an ‘overarching’ indication of the player’s performance. This was broken down by matchday, to show specific trends (e.g you expect a drop in physical performance during the busy Christmas period), and included an average line to quickly see matches where a player was below their average. By selecting a match, the user is then able to see a player’s performance in Acceleration, Heart Rate, Peak Speed and Distance Covered, during the training sessions leading up to the selected match(es).
Final Thoughts
Overall, I was happy to be able to get my planned functionality of my dashboard working. I should have done a better job of planning, and with more time the final formatting of my dashboard would have been a lot different. For example, include some branding on Chelsea, make my fonts and colours a bit less generic and space things out better.