Parameters in Tableau are like control knobs for your dashboards. They let users change values on the fly — switching measures, setting thresholds, or adjusting rankings — without editing the workbook.
When used well, parameters turn static charts into interactive decision-making tools.
When to Use Parameters
- Let users switch between measures (Sales vs Profit)
- Create a “Top N” list where N is user-defined
- Build “What-if” scenarios
- Set thresholds for highlighting values
- Control calculations dynamically
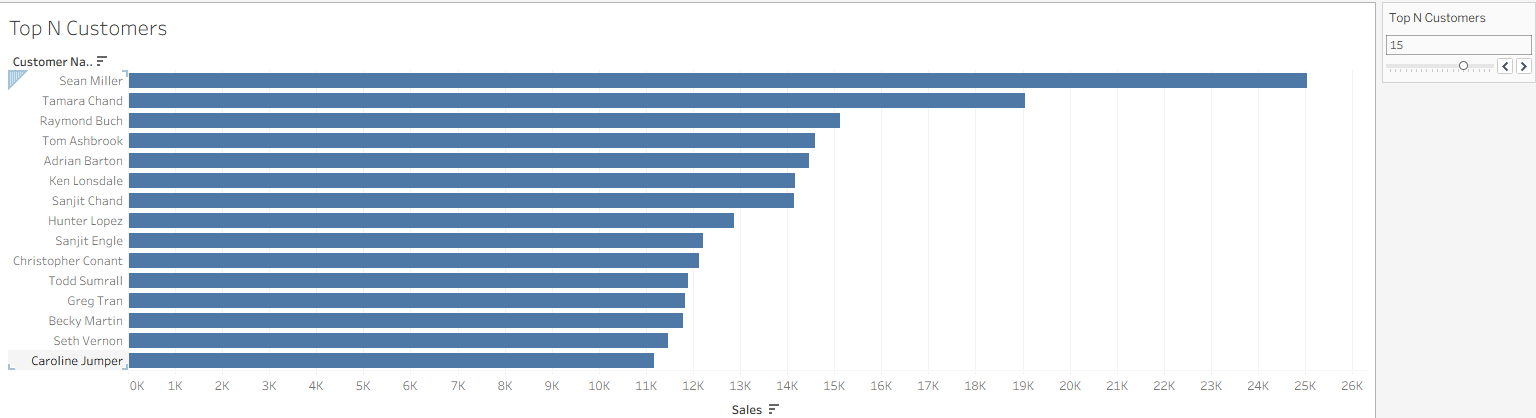
Example: Create a Top N Customers Control
We’ll build a parameter that lets users choose how many top customers to see.
Steps:
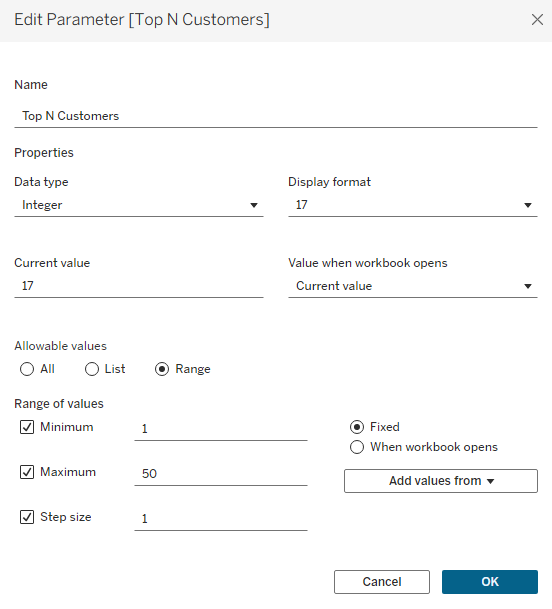
- Create Parameter
- Right-click in Data Pane → Create Parameter.
- Name: Top N
- Data Type: Integer
- Current Value:
10 - Allowable Values: Range (1 to 50)
Show Parameter Control
Right-click the parameter → Show Parameter.
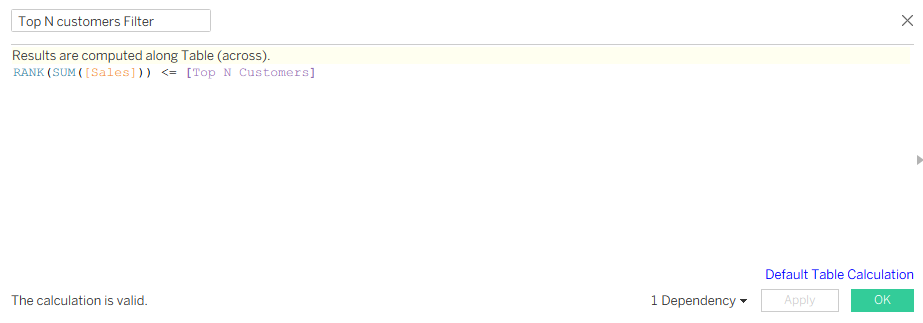
Create Calculated Field
Name: Top N Filter
RANK(SUM([Sales])) <= [Top N Customers]
RANK()assigns a position to each customer based on their Sales total.- By default,
RANK()orders from highest to lowest. [Top N Customers]is a parameter the user controls (e.g., set to 10).- This condition checks:
“Is this customer’s rank less than or equal to the value in[Top N Customers]?” - It returns True for customers in the top N by sales, False for everyone else.
Build the View
- Place Customer Name on Rows
- Place Sales on Columns
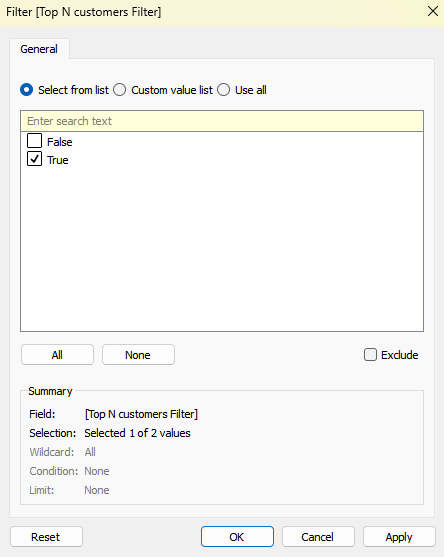
- Drag Top N Filter to Filters → select True
- Move the slider on the Parameter to instantly see more or fewer customers.
✅ Result: You can dynamically change the number of top customers shown in your chart.