


Key Performance Indicators (or more commonly referred to as KPIs) are essential tools within dashboards as they can help provide a clear and real snapshot of key metrics in real time. Many users love having KPIs in dashboards (as seen in my Friday 28th February PowerBI Project – shameless plug to that blog here) because they offer instant clarity on performance without the need to explore the dashboard in depth, allowing for users to quickly monitor their performance.
There are many ways to build KPIs in Tableau and they can tell you anything. In this blog, I am going to show you how I designed the KPI below. One important note however, is that this is just one way of doing it – it’s not the right way to do it, or wrong way to do it, just a way of doing it.
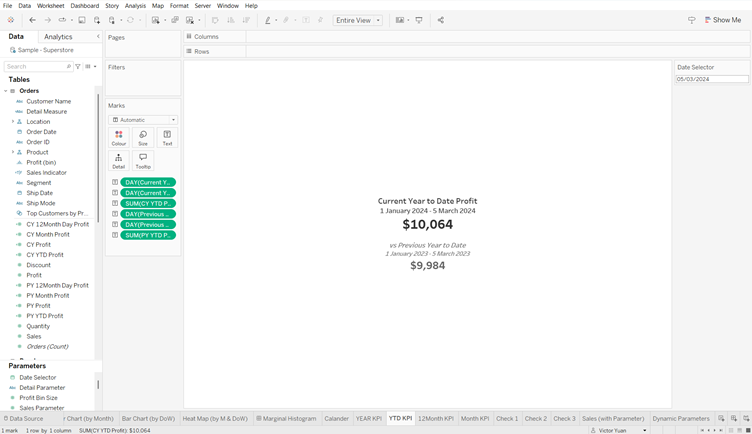
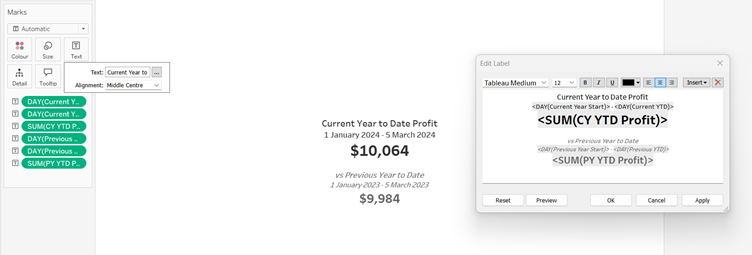
This KPI tells us the ‘Year to Date’ profit for a store, whilst also showing the same for the previous year as a comparison. This ‘Year to Date’ is also dynamic, where the user can change their ‘Target Date’ using a parameter, with these dates also being present on the KPI for additional clarity of when the data is for (also as a validation that the data is being picked up for the right timeframe).
To build our YTD KPI, we will be using Carl’s 4 steps to building a parameter:
Step 1 – Create a Parameter
Step 2 – Show the Parameter
Step 3 – Create the Calculated Field with the parameter
Step 4 – Use the Calculated Fields in the worksheet
*Note: Carl is the Data School’s Head Coach and a Tableau Hall of Famer – so using his words, he knows his stuff
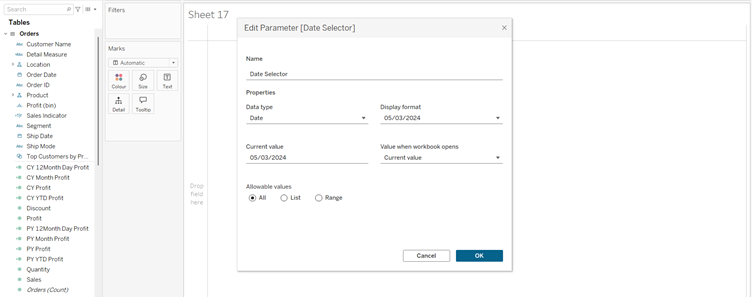
Stap 1 – Creating the Date Select Parameter
The first thing to do is to create a date select parameter. This can be done using the create parameter function, selecting the data type as ‘date’. In this instance, I have called this parameter ‘Date Selector.’
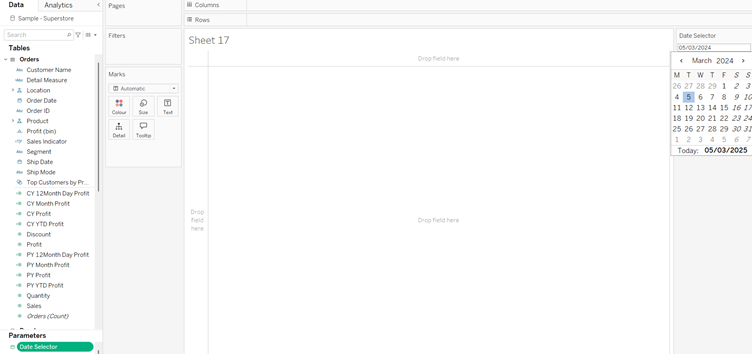
Step 2 – Show the Parameter
The next step is ensuring that the parameters are visible on the worksheet. Whilst this step technically can be performed at any subsequent steps, adding this on after creating it ensures that you don’t forget this after building the dynamic KPI. This can be added by right clicking on the parameter and selecting ‘Show Parameter’
Step 3 – Create the Calculated Field using the parameter
Arguably the hardest step is creating the calculated fields that will react upon the parameter. The best way to approach this is to plan for what elements you will need to be able to create your KPI measure. For myself, I like to first break these down further into the date fields that are directly affected by the parameter and will be used in the calculations to get out KPI’s. In this instance, we require 4 different date fields: Current YTD, Current Year Start, Previous YTD, and Previous Year Start.
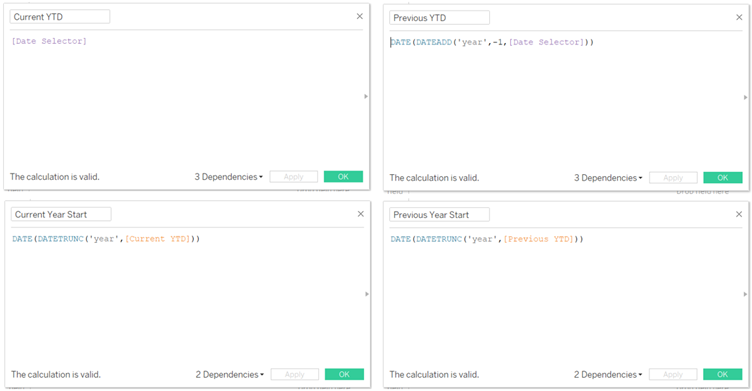
With the Date being chosen by the parameters ([Date Selector]), we can add this to our calculated field to be our ‘Current YTD’. This means that our ‘Previous YTD’ needs to be this date minus one year hence we are using the dateadd function but adding -1 to get the previous year.
The datetrunc function truncates (shorten by removing elements) the date based on a date_part. In our case, we use this with a ‘year’ date_part which returns the date back at a particular specificity (in our case the year). As dates need a value for day, month and year, the function sets the values as the lowest possible value for each date part up to the specified date part (hence will returns the day/month part as the 1st of January) giving us the start date of that year.
The next step is creating a logical calculate field that tells us which lines of data to use based on the date fields we have just made (wow another shameless plug here but I have a blog about logical functions and what they are so I won’t go too much in detail now – but you can read them here).
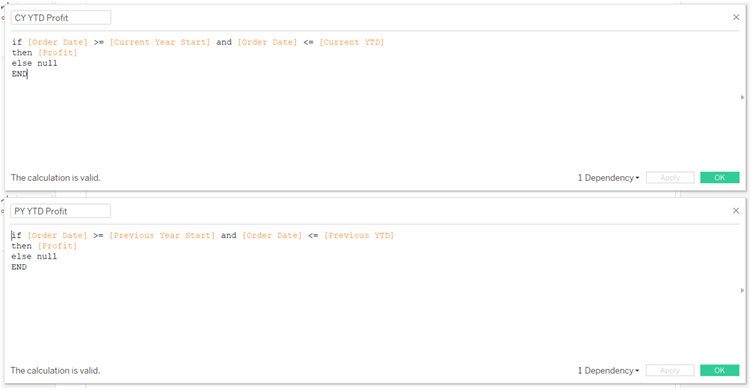
The IF statements used here searches for the orders that were between the ‘Year to Date’ and the ‘Year Start,’ returning the profit for that order if it met that criteria.
Step 4 – Use the Calculated Field Parameter
Now there isn’t really much point in doing all these steps (especially the last one) if we don’t actually add in the calculated fields into the worksheet. I added in my calculated fields as text in the worksheet using the sum aggregation for the profits. I then did some edits and format changes to the text to make it look nicer.
And that was it. As I mentioned at the start, this is just one of many ways you can do this. Just go and check out some of the other blogs by my colleagues in DS49 and see how they approached making something like this.
Thanks for reading! 😊
Victor