


In Microsoft Power BI, you can use DAX to define custom number formats, allowing you to control exactly how values appear in your reports. This is especially valuable in dashboarding, where clear, consistent and easy-to-read KPIs make a big difference.
Understanding the syntax
Custom formatting relies on a few key symbols:
- # → represents an optional digit (only shows if a value exists)
- 0 → represents a required digit (always displayed, even if it’s zero)
- , → comma divides the number by 1000 for each comma used
- , → thousands (K)
- ,, → millions (M)
- You can append text like K or M to label scaled values
- . → full stop defines the decimal point
An example
Taking value: 1,250,000
Controlling decimals
- 0.00 → always shows 2 decimal places (e.g. 5.6023 → 5.60, forcing trailing zeros even though 5.6 represents the same value)
- 0.# → shows up to 1 decimal place (only if needed)
- 0.## → up to 2 decimal places
- 0.### → up to 3 decimal places
The difference between #.## and 0.## comes down to whether a leading zero is enforced.
A few more examples
Generally
- 0.00 → always 2 decimal places (best for currency, financials, comparisons)
- 0.## → up to 2 decimal places (best for KPIs, summaries, reducing visual clutter)
Formatting percentages
The % symbol multiplies the value by 100 and adds the percentage sign.
So if your data is already in percent form (e.g., 25.67), it will display as 2567.34% instead of 25.67%.
Let’s take 0.256734
- 0.00% → fixed 2 decimal places (e.g. 25.67%)
- 0.#% → flexible decimal place - showing up to 1 decimal place, only if needed (e.g. 25.7%)
Formatting percentage changes
Custom number formats can handle positive, negative and zero values separately using semicolons. The structure is:
Adding visual indicators (triangles)
You can enhance this by adding symbols (like triangles) directly into the format string.
For example:
🔺 0.#%;🔻 -0.0%;0.0%
The order is always applied automatically: positive → negative → zero
Working through a challenge together
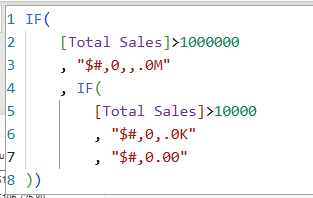
The calculation above shows the following:
- If sales are greater than 1,000,000 → show in millions (M)
- Else if sales are greater than 10,000 → show in thousands (K)
- Else → show the full number with 2 decimal places
Let’s read the syntax:
- $ or M are the labels
- #,0 formats the numbers
- ,, scales numbers down
- .0 is decimals
To be able to interpret this easier, I would reshuffle and figure out what you need to do by:
- Scale number down
- Format number normally
- Add decimals
- Add label for result
Things to look out for:
- > vs >= matters as one excludes the boundary value, the other includes it
- In custom formats, conditions are evaluated top to bottom, so the first matching rule is applied. You don’t need to overcomplicate logic - earlier rules take priority.
Lastly….get practicing and see how you can improve your KPIs on your dashboards to be more readable and be creative with them - explore how different icons or emojis can be used to show differences.