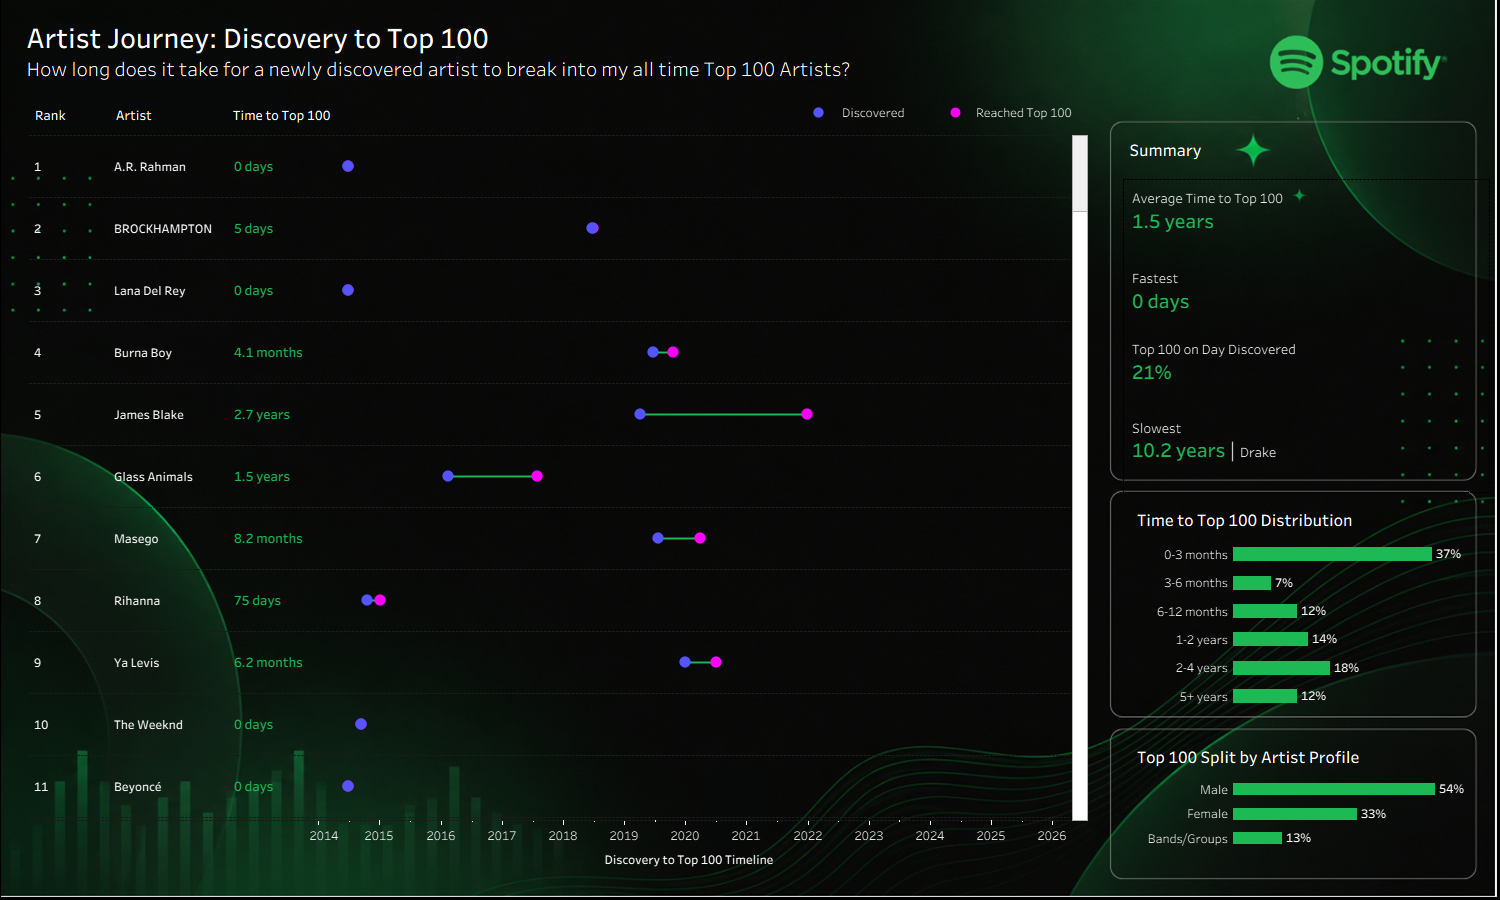
I love Spotify Wrapped and the annual deep dive into my listening habits. When I requested my full Spotify data and started building charts of my top artists and songs, one question kept coming to mind: how long did it take for each artist to make it into my all-time Top 100 from the very first day I listened to them?
The Main Challenge
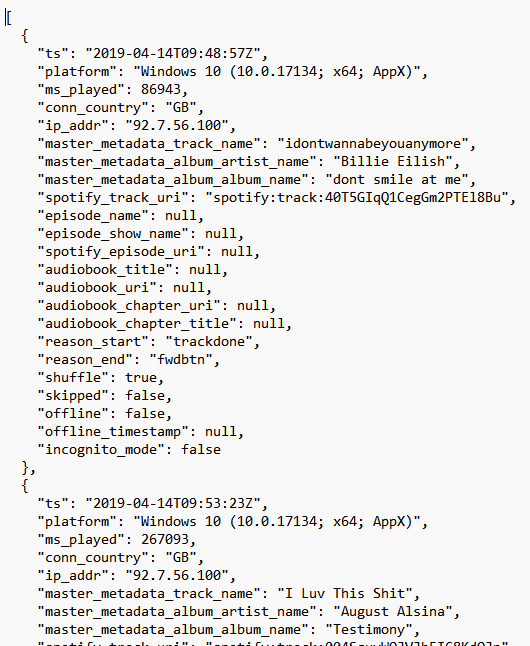
Spotify exports listening history across multiple JSON files (with multiple per year at times), with each record representing a single listening event (listening time of 30 seconds or more).
Each JSON file contains thousands of nested records, so the first challenge was converting that into a usable table.
Step 1: Importing the Data into Alteryx
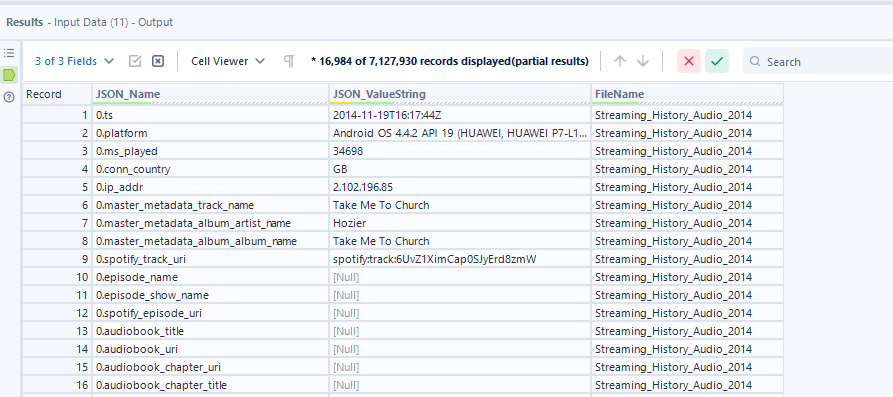
Using the Input Data tool, I imported each JSON file into Alteryx using a wildcard pattern to retrieve all files across every year.
Initially, the data doesn't appear in a traditional table format. Instead, every JSON property is stored as a separate row, with the field name containing both a record number and the JSON field name.
The output looks something like this before it's transformed.
Step 2: Splitting the Record Number from the Field Name
In the JSON_Name column, the number before the full stop identifies which listening record the field belongs to.
To separate these values, I used the RegEx Tool with the following expression
(\d+)\.(.*)
This pattern works by splitting the text into two capture groups:
- (\d+) captures one or more digits (the record number)
- \. matches the literal full stop
- (.*) captures everything after the full stop (the field name)
This gives me two new fields:
The Record ID lets me rebuild each listening event later.
Removing Empty Records
Some rows contained no values at all, so I filtered these out before continuing. There's no point carrying unnecessary rows through the workflow.
Step 3: Converting the JSON into a Table
The data was still stored vertically, with field names listed as rows.
Using the Cross Tab Tool, I pivoted the data so that the field names became column headers instead.
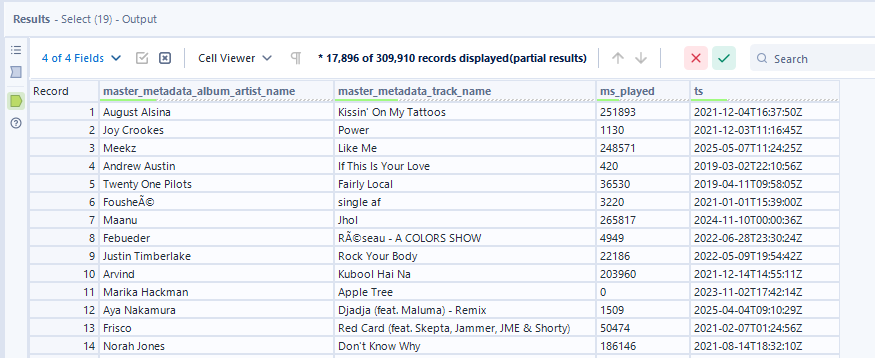
Each listening event was now represented by a single row.
At this point I also removed fields I didn't need for my analysis, such as audiobook-related columns and other metadata that wasn't relevant to artist listening history.
The resulting dataset looked much cleaner.
Step 4: Converting and Calculating Dates
After the Cross Tab, every field had been imported as a string.
To perform any time-based calculations, I converted Spotify's ts field into a proper DateTime using the DateTime Tool.
Since I only cared about the Date something happened, not the exact time of day, I converted the timestamp to a Date field.
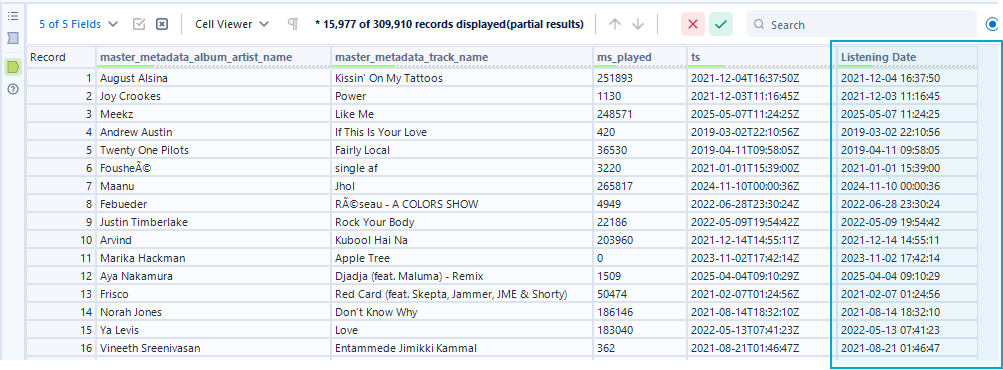
Finding Each Artist's Discovery Date
Next, I grouped the data by artist and calculated the minimum listening date.
This became each artist's Discovery Date, the first day I ever listened to them.
I then joined this back onto the main dataset so every listening event also contained that artist's discovery date.
Step 5: Calculating Daily Listening Time
The next step was to summarise listening by:
- Artist
- Listening Date
For each day, I calculated:
- total milliseconds listened (Sum(ms_played))
- the artist's discovery date
This reduced multiple plays on the same day into a single daily total while keeping the discovery date attached.
Step 6: Building a Running Total
I sorted the data by:
- Artist
- Listening Date (ascending)
Then I used the Running Total Tool to calculate cumulative listening time for each artist.
This allowed me to see how total listening accumulated over time.
Step 7: Identifying When an Artist Entered My Top 100
At this point the workflow split into two separate streams.
Stream 1: Find My Overall Top 100 Artists
I grouped by artist and summed total listening time across my entire Spotify history.
This produced each artist's lifetime listening total.
Stream 2: Find When They Reached Their Top 100 Milestone
Using the cumulative listening totals, I sorted each artist by listening date and used the Sample Tool (First N Rows) to capture the first date where that cumulative total reached the threshold I'd later use for my Top 100 analysis.
This gave me the First Date at Top 100 for every artist.

Step 8: Joining Everything Together
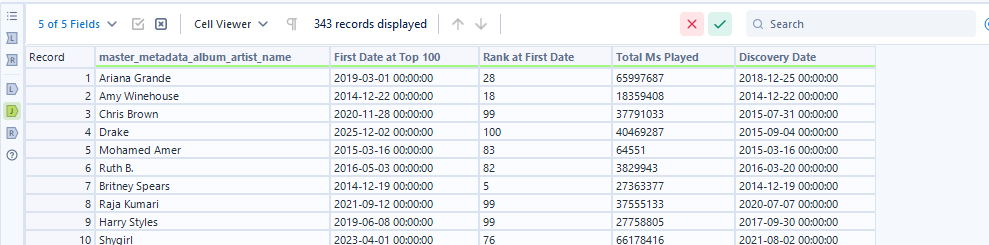
After that, I joined both streams together so each artist had:
- Artist Name
- Discovery Date
- First Date at Top 100
- Total Listening Time
These were all the fields needed for the dashboard.
Step 9: Ranking My Top 100 Artists
Finally, I:
- filtered out blank artist names
- sorted artists by total listening time (descending)
- assigned an Overall Rank using the Multi-Row Formula Tool -> [Row-1:Overall Rank] + 1
After filtering to Overall Rank ≤ 100, I had my final dataset.
Step 10: Calculating Time to Reach the Top 100
The final calculation was done in Tableau using:
DATEDIFF('day',[Discovery Date],[First Date at Top 100])
This returned the number of days it took each artist to go from first listen to becoming one of my all-time Top 100 artists.
Last Tips
To make the dashboard easier to read, I converted values greater than 365 days into years using a detailed calculated field, so longer time periods displayed as years instead of large day counts.
I hope this gives you a good starting point to experiment with your own Spotify data!
Click here to view the dashboard on Tableau Public.