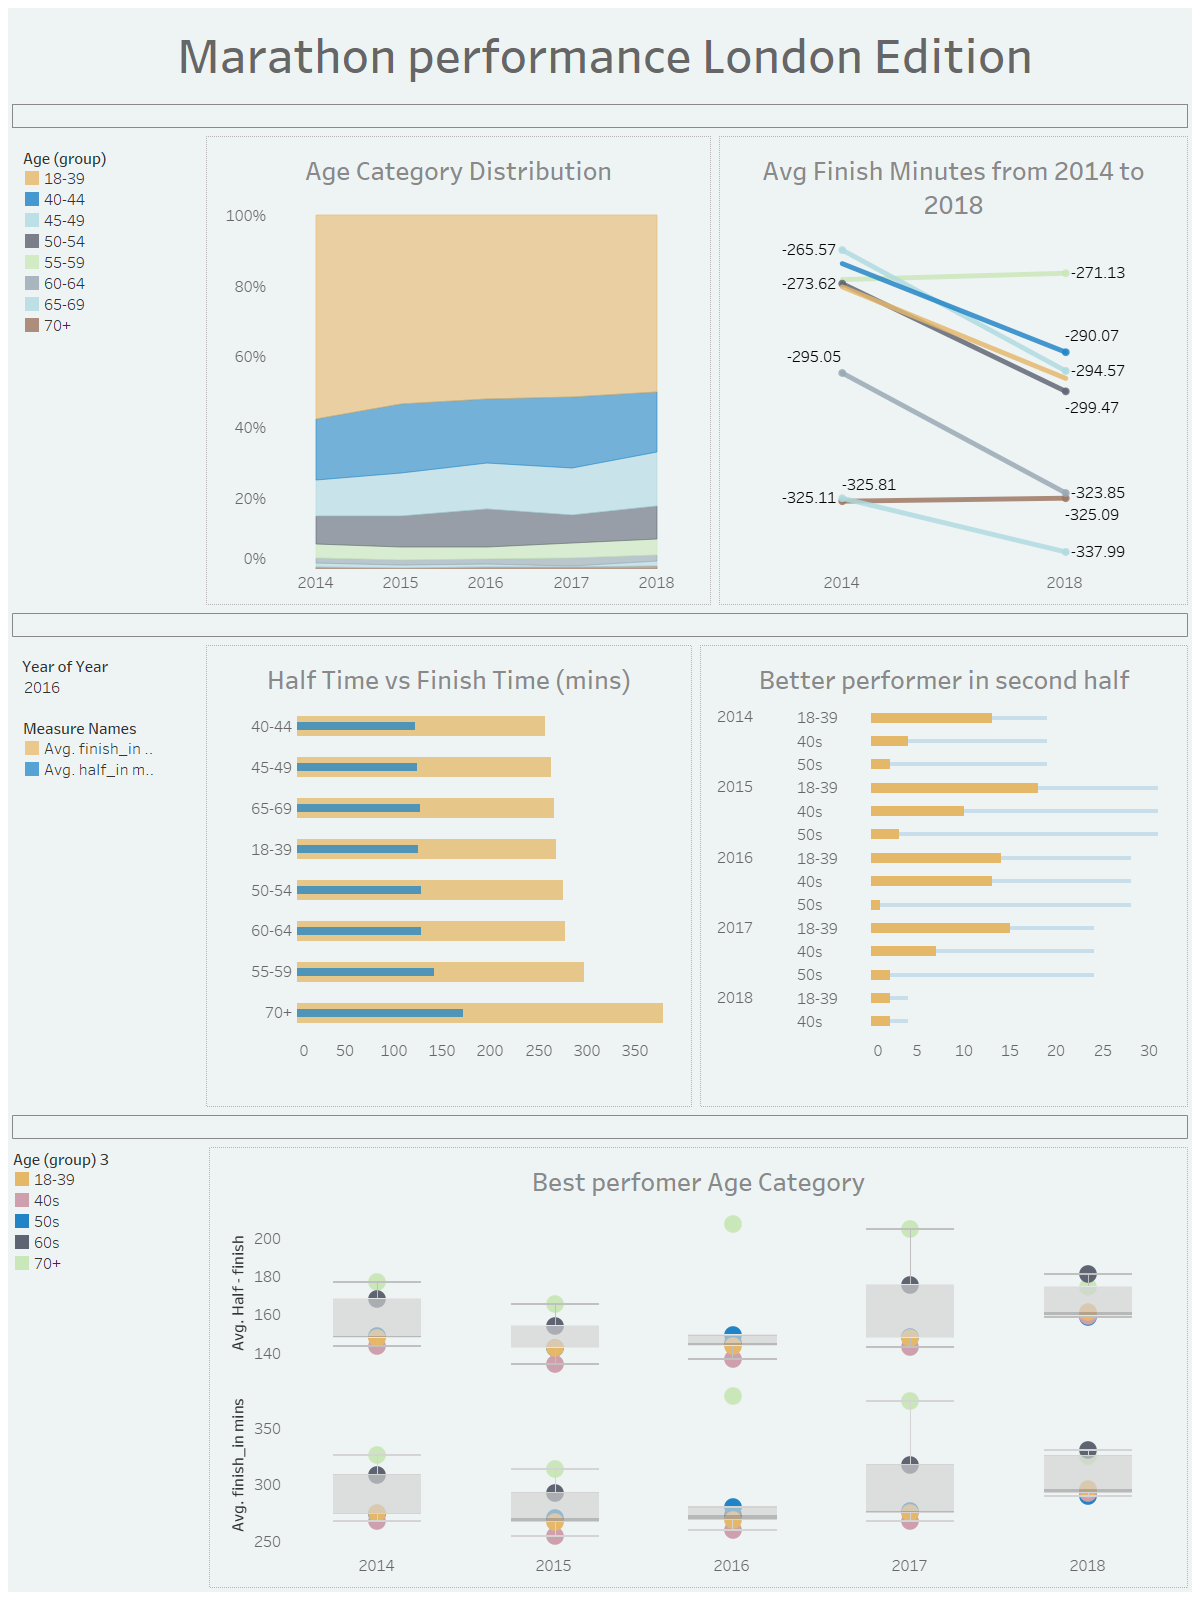
Today's Objective was we needed to visualize historical results of the London Marathon.
We needed to download the data from 2014-2021 for each page and each year. At beginning i was excited to do web scraping. So i hopped on the board quickly.
Data Prep: We had a look at the data and started web scraping in alteryx. I had a plan to use the macro to automate the scrapping by year and the page. But ended up doing it by manually reason behind is year 2021 to 2018 had different html format compare to year 2014 to 2018. Another issue faced was column structure were different in each year. Some of the year didn't not have half time of marathon. It took almost half a day to prep the data.
Dashboard design: My plan was to compare the performers over the year and by age group. Therefore, I analysed the age distribution over the year. Second, I looked into the avg. time taken by the participant to finish the marathon as well as half time. Then i took age group into the account and check which group performs better in both category(haf time and finish time). It was very interesting to find out that participant in 40s constantly perform better though out all the years than any other groups. Also it was interesting to see that most of the participant perform better in second half were age group 18-39.
Here is my dashboard of the day. Link

