When attempting to limit your data within Tableau, you will have a bunch of filters to reckon with. There will be different use cases for each one and a specific order in which they should be used, so it is good to have a basic, high-level understanding of your various options.
Before we look at the differences between the filters, we need to take a look at their order of operations. Also known as the 'query pipeline' by Tableau, the order of operations determines the order in which actions are executed on a sheet. This primarily applies to the various filters one can utilize, but it also concerns other values such as Level of Detail expressions, which act as a filter in their own way. Take a look at the order of operations from the Tableau website below:

The picture clearly demonstrates not only the number of filters there are in Tableau (which is a lot) but the order in which they are applied to a visual. Starting from the top, we are going to briefly cover the usage of each filter, where you can find them, and the differences between them.
Extract Filters
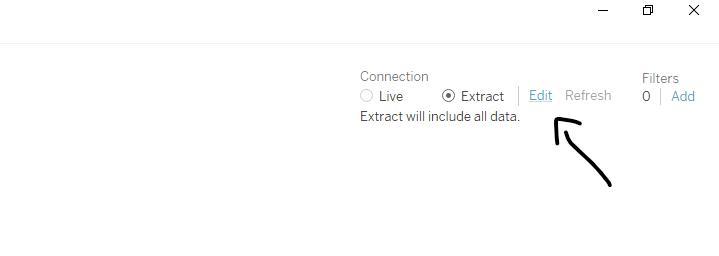
The highest level filter that can be applied to your workbook is an extract filter. Similar to the "Where" clause used in a SQL query, the extract filter will completely remove whatever you have decided to filter out from your entire dataset and it will stay this way on the extract data source you save on your computer.
It is important to note that if you don't extract your data source and decide to keep it live then the extract filter will have no impact on your data. The extract filter will appear under the data source section of Tableau once you have chosen to extract your data.
Data Source Filters
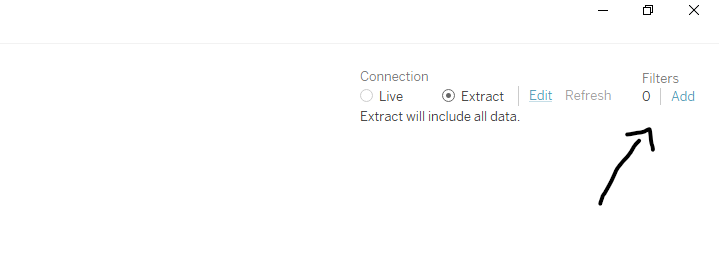
At the second level are data source filters, which will filter on all sheets using the referenced data source. Interestingly enough, if you decide to extract your data then your data source filters will request to become extract filters. Data source filters can filter live or extracted data, but unlike extract filters, they will keep the data being filtered out, just not show it. This can be valuable when you are sharing workbooks on the server as the data may still exist, but access can still be limited. When you are in a worksheet and choose to apply the filter to all sheets with the same data source you are creating a data source filter. The other way to create a data source filter is to go back to the data source section of Tableau (similar to the extract filter) and click the 'Add' button on the top right of the screen (pictured below).
Context Filters
The context filter will act as an independent, high-level filter that will establish conditions for your sheet before you apply a dimension or measure filter. The best usage I have seen of a context filter was when someone wanted to apply a Top 5 filter of cities based on total sales of the state of California. If there is a state filter and a city filter both at the dimension level, then the Top 5 would only show Californian cities that would have appeared before a filter was applied. Therefore, if Los Angeles and San Fransisco were in the top 5 for the whole country they would be the only ones to be listed. By applying a context filter, we can tell Tableau that we want the top 5 cities of California, not of all the states but only show cities that are in California.
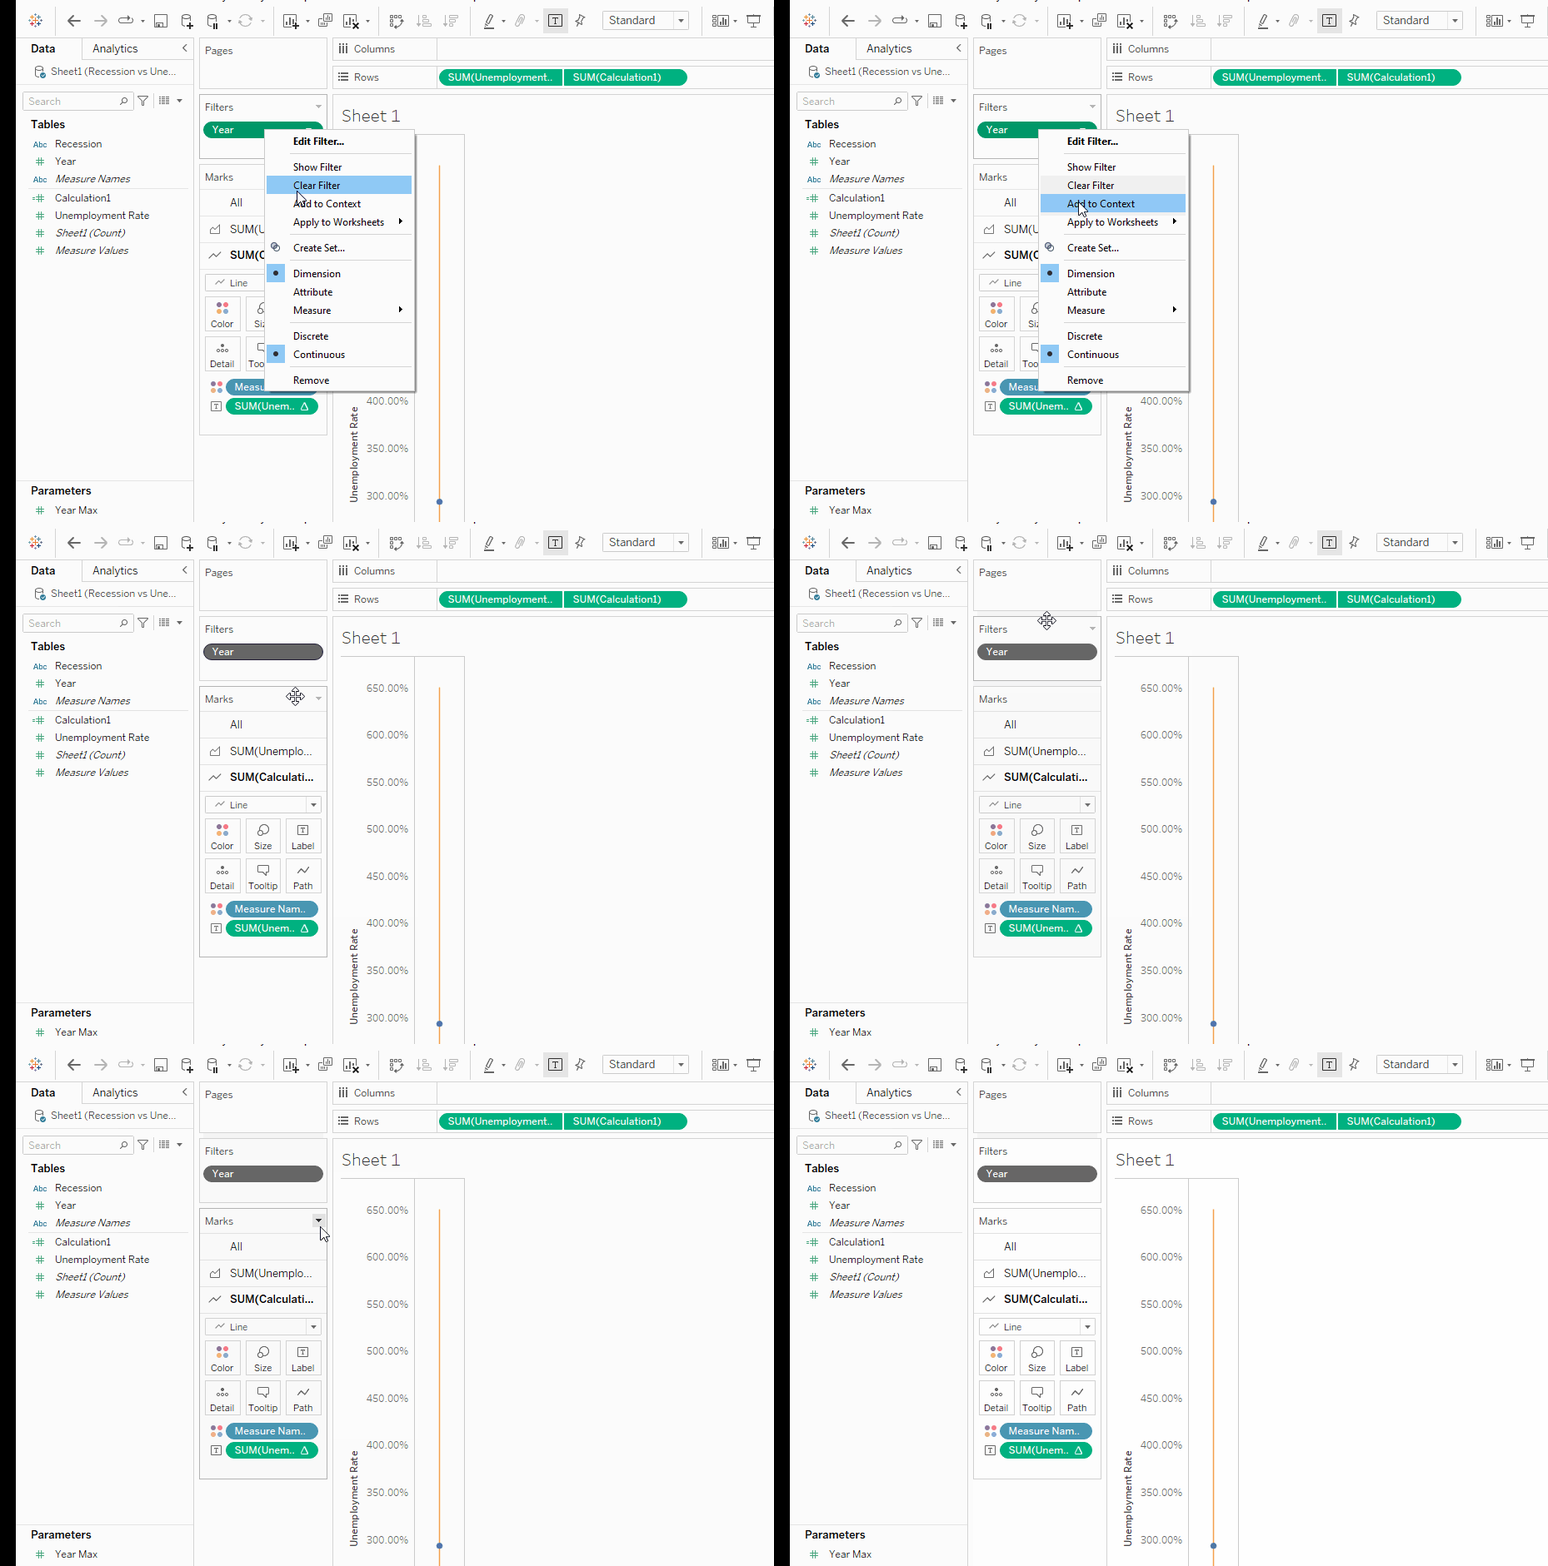
Essentially, a context filter is forcing Tableau to look at one filter before looking at another. The subsequent dimension and measure filters become dependent on the independently operating context filter, which at times can be very valuable. Creating a context filter is easy enough to set up. Right-click on your dimension or measure filter and choose 'Add to Context'. The filter will go from its original color to gray, which is the best indication that it has become a context filter.
Dimension and Measure Filters
Dimensions and measures are low-level filters that will only apply to the sheet the filters are being used on (unless you change them to a data source filter). Your options for these filters will have been influenced by the other filters you have set, but they are easy enough to use. A dimension filter will allow you to filter values based on dimensions that are being expressed on the sheet.
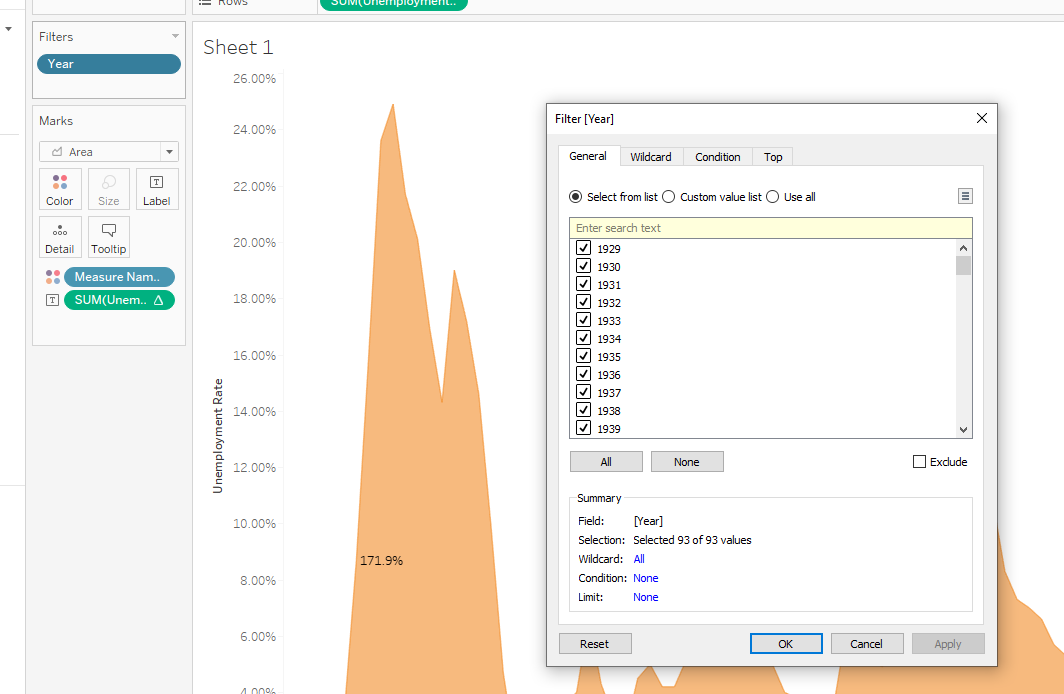
A measure filter will show you the range of values being expressed on the sheet and similarly allow you to limit that range to filter out certain values. Whether a value is discrete or continuous will also impact how the filter options appear. Note the differences between a discrete and continuous year value:
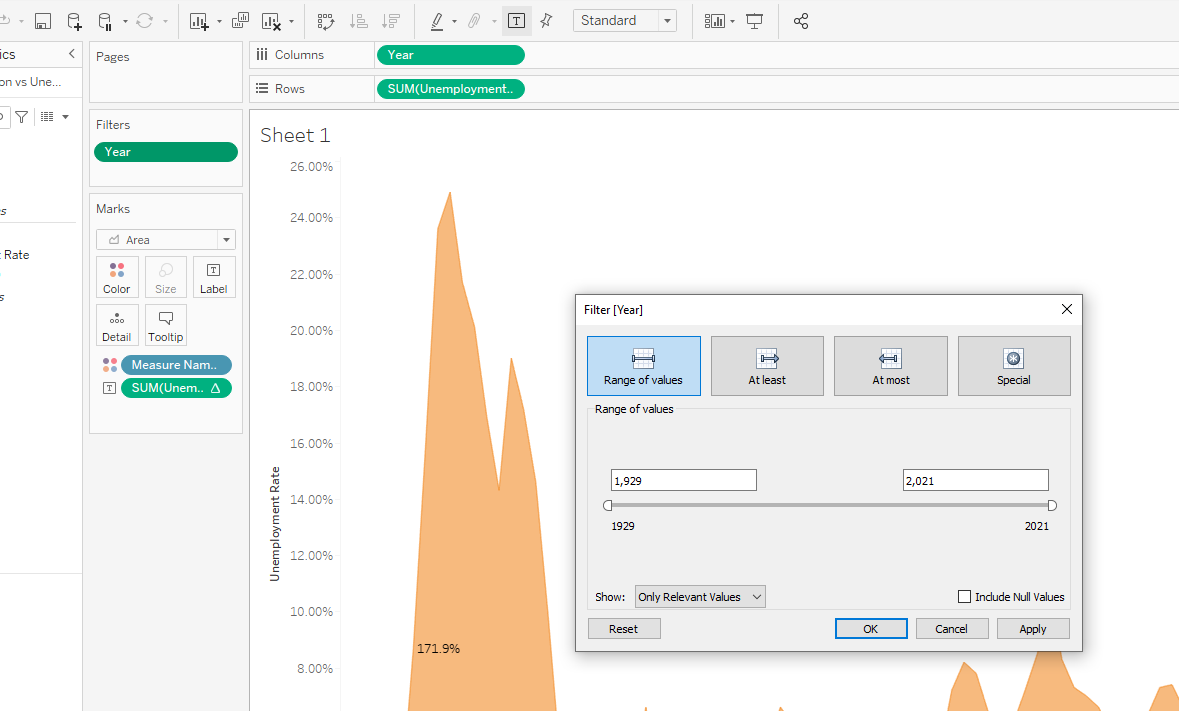
Table Calculation Filters
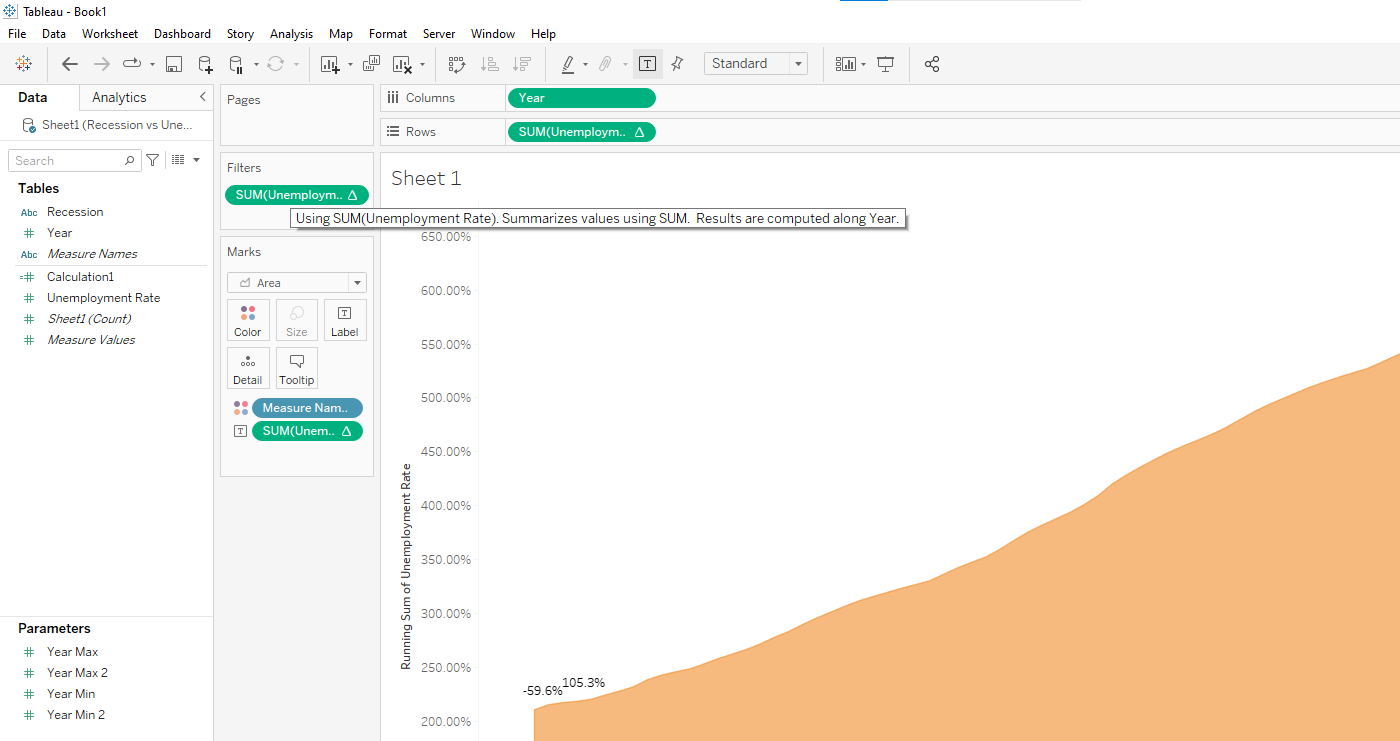
It makes sense that table calculation filters are at the lowest level because table calcs. rely on the view being seen on the sheet when running calculations. Imagine you have ranked a bunch of products on a sheet using a table calculation and you want to filter by the rank. The table calculation filter will look at the table calculation being used in the visual when filtering. Be careful applying table calc. filters on sheets that are also using table calcs. because some calculations, such as the running total, may not change as you expect. If we were to put a 'Last(3)' table calc. filter on a running total visual (which would show the last three points on the visual), the running total will not reset to zero.
Good luck, and feel free to reach out for assistance! Resources used:

