Among the options to visualize magnitude of a phenomenon as color in two dimensions or in a geographical area, heatmap produces an optimal solution. In this blog I will tell you how to create a heatmap in Alteryx and visualize it in Tableau, using the London Crime dataset.

First I need to connect my 2 datasets to Alteryx with the Input Data tool. The first csv file covers the crime details such as area’s latitude and longitude in London, crime type…etc. The second file which is a shape file (*.shp) contains the polygon spatial objects and relevant notations. For a better and faster data processing purpose, I select only the relevant fields from the first csv file to create points, which are Crime ID, Longitude, Latitude, LSOA name, and Crime type.
The next step is very important to generate the spatial objects that we want here: Create Points.

When you connect the output of Select tool to the Create Points tool, Alteryx automatically returns Longitude in X Field and Latitude in Y Field which is pretty opposite to the similar function Makepoint() in Tableau (a gentle reminder that many people match them incorrectly). Fields are Lat/Long Floating Point, which automatically convert the string type of Lat and Lon in the previous step. Then hit run, the result is the green centroid column created.

In the second shape file, just select the SpatialObj and the name of the Borough. After that, combine this with the output of the Create Points by a tool called Spatial Match. This tool accepts a set of spatialobjects from the Target T input (centroid) and a set of spatial objects from the Universe U input (SpatialObj). Just go ahead and choose “where Target interests Universe” then hit run.

This tool also has 2 output anchors: MatchedM and Unmatched U. The Matched anchor simply returns all the overlapping points of the two datasets, in other words, the spaces where crime takes place in London. The Unmatched does the other way round. Below is the map showing the crime situation in London.

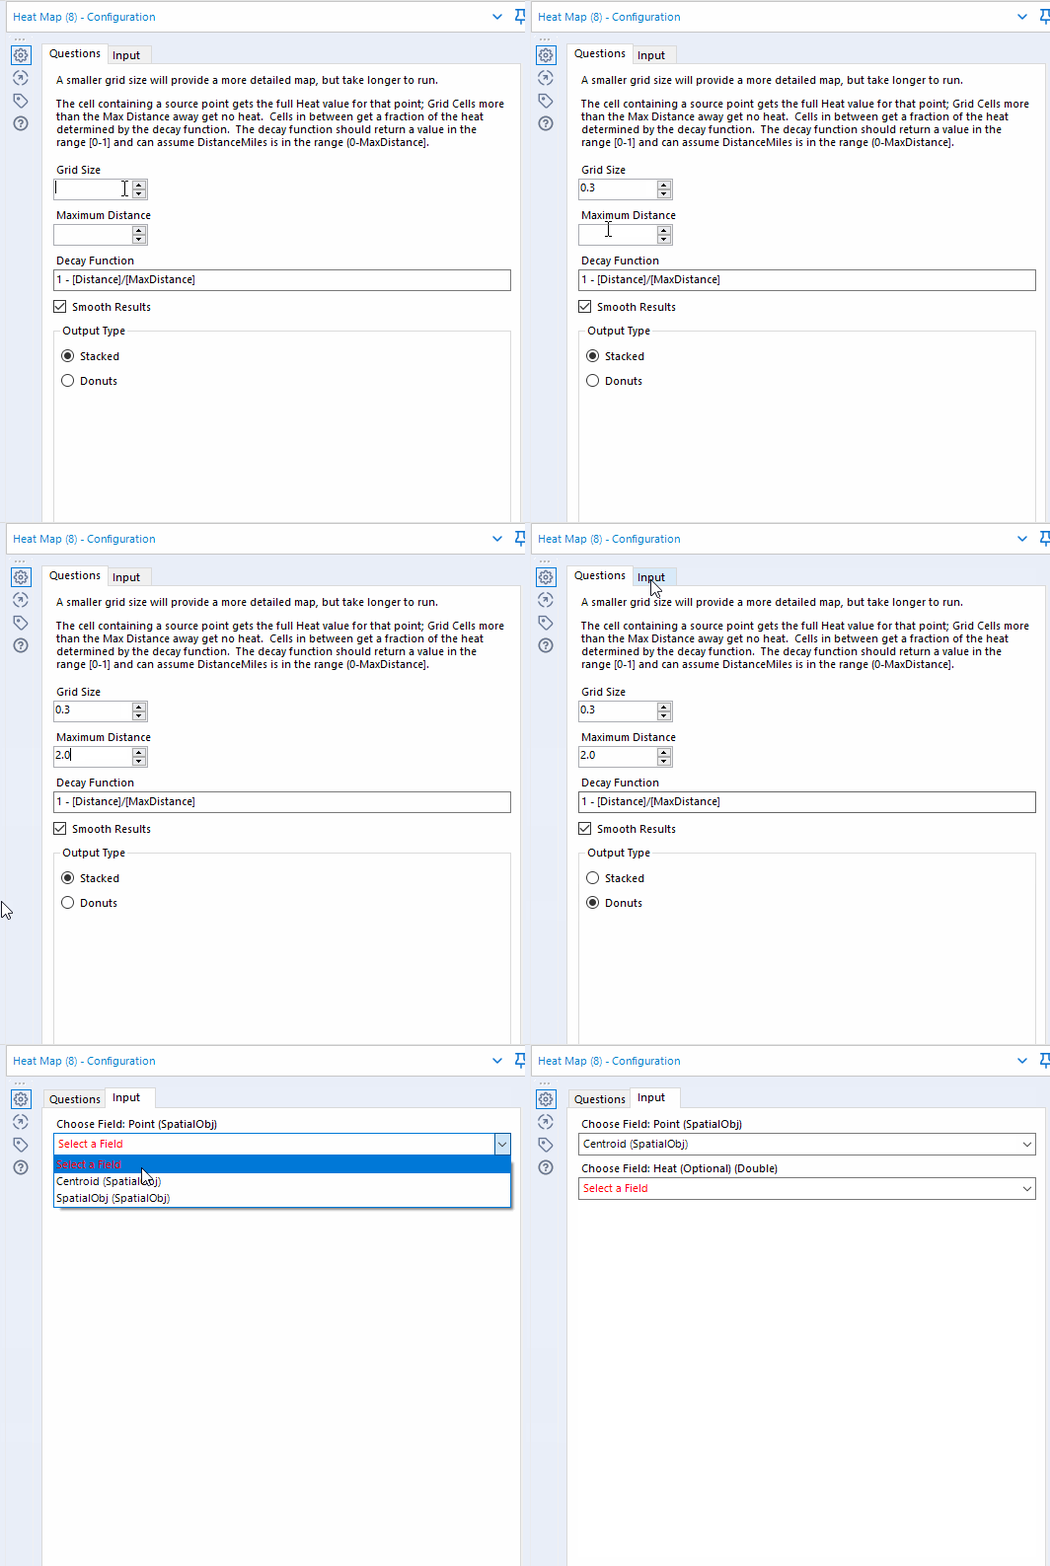
Now that the map looks very crowded and we are interested in showing different levels of heat in given area by presenting the area like a donut chart with layers based on different radius from center. From the Spatial toolbar tab, choose heat map with the following configuration:
Grid Size: The tool's process is based on grid cells. A smaller grid size produces more grid cells, giving a more detailed map as a result, but takes longer to process.
Maximum Distance: This is the maximum distance at which heat from one cell can contribute to the final heat level of another cell.
Decay Function: Cells get full heat from points inside them, and no heat from points beyond the max distance, but in between they must get some fraction based on the distance to the heat source. Selecting this causes a series of smooth/generalize operations designed to straighten edges and round corners.
Smooth Results: The results of the tool consist of aggregated grid cells, which can look quite jagged.
Output Type: The tool produces polygons representing different levels of heat. It can be helpful to have these as either non-overlapping Donuts each containing a single heat level, or as Stacked polygons each containing their own heat level, and all higher levels.
The Input tab contains 2 mandatory fields.
- Choose Field: Point (SpatialObj): A spatial object field containing points the represent the heat sources.
- Choose Field: Heat (Optional) (Double): An optional numeric field specifying how "hot" this particular point is.

The final result is the heatmap below. All you have to now is save this output file as the Tableau Data Hyper Extract or Tableau Data Extract and use it as the data source when opening Tableau Desktop.

There we go, the last job is as simple as it is !!!

