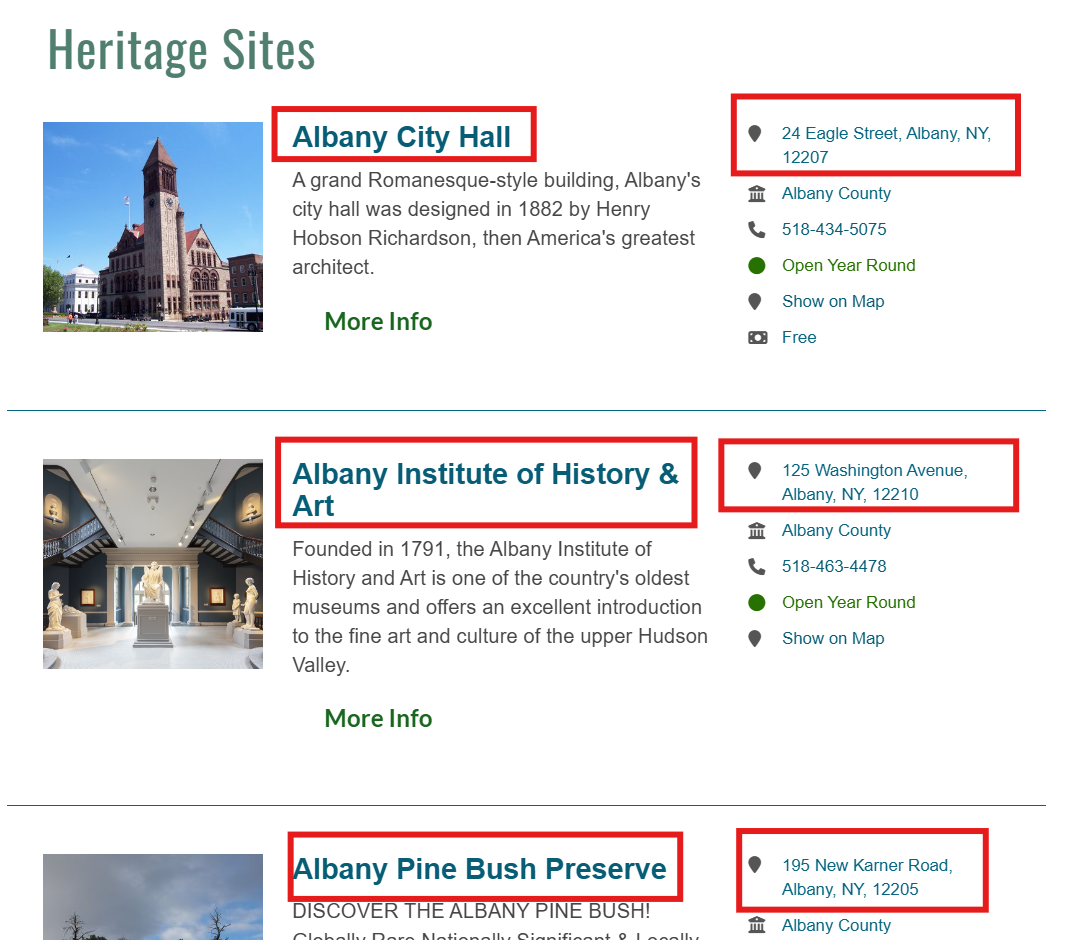
Today, we want to obtain the exact geographic coordinates (latitude and longitude) for all the heritage sites in the Hudson Valley. The Hudson River Valley Heritage Area website provides this information in the form of site names and addresses. Our goal is to convert those addresses into precise coordinates.
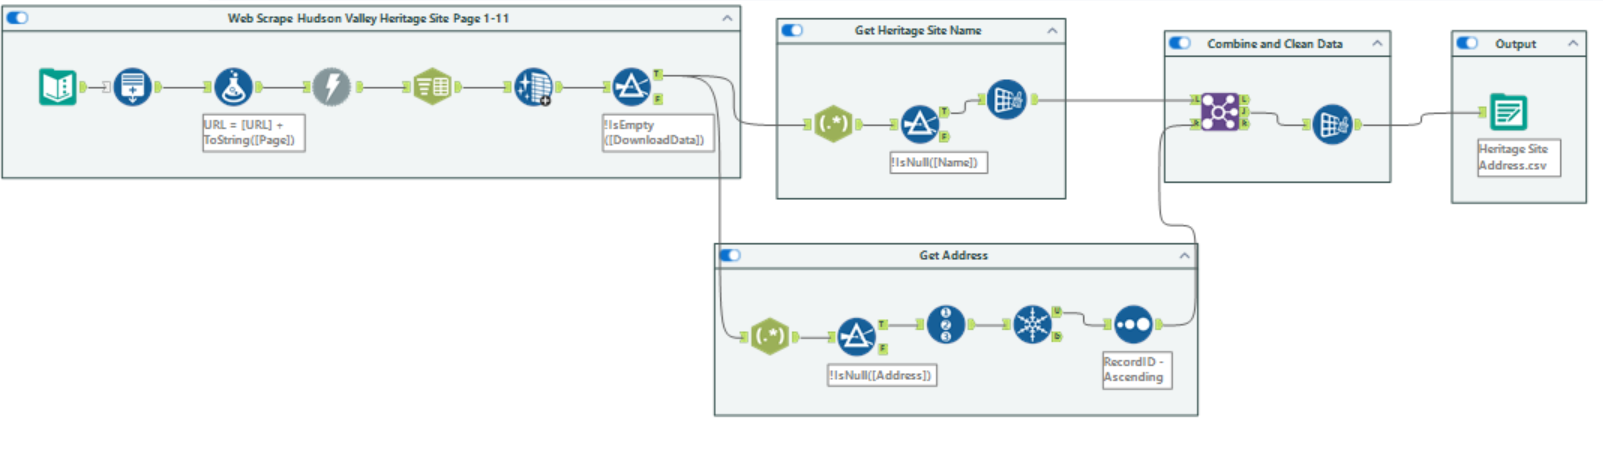
First, you can build an Alteryx workflow like the one shown below to scrape data on the names and addresses of all heritage sites across the website’s pages.
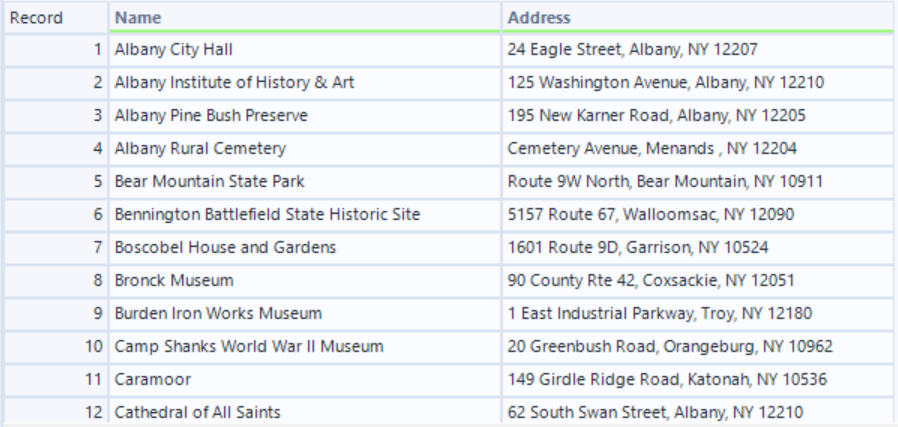
Once that is complete, you will have a dataset like the one shown below, which you can then save as a CSV file.
Now here’s the cool part: once you have a specific address like this, you can actually obtain the latitude and longitude quite easily using a Python geocoding library such as geopy.
Note: I am using Google Colab, and the file is uploaded directly into the runtime.
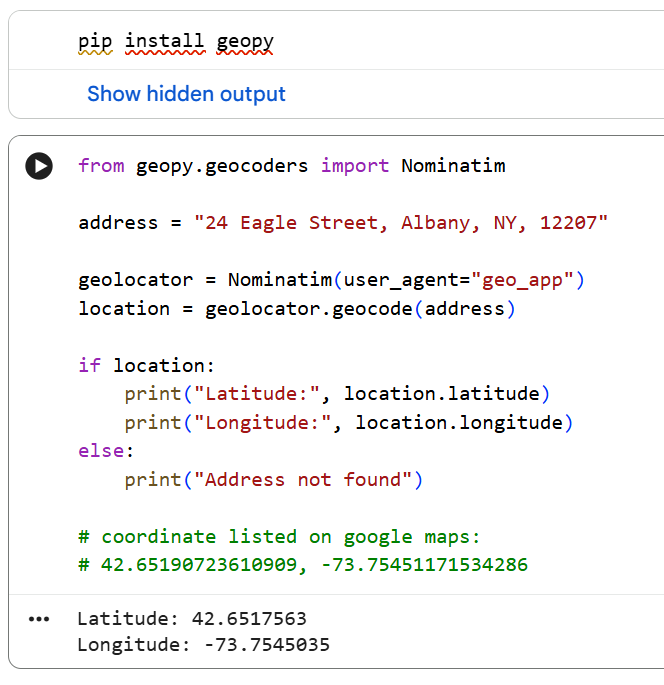
The code above takes a street address and returns the latitude and longitude for that location.
More specifically, the code sends a request to the Nominatim server, which searches OpenStreetMap data and returns the corresponding coordinates. If OpenStreetMap sounds familiar, that’s because it is also used by Tableau for its mapping functionality.
You can see that the output closely matches the coordinates you would find on Google Maps, which is a helpful way to confirm that everything is working correctly.
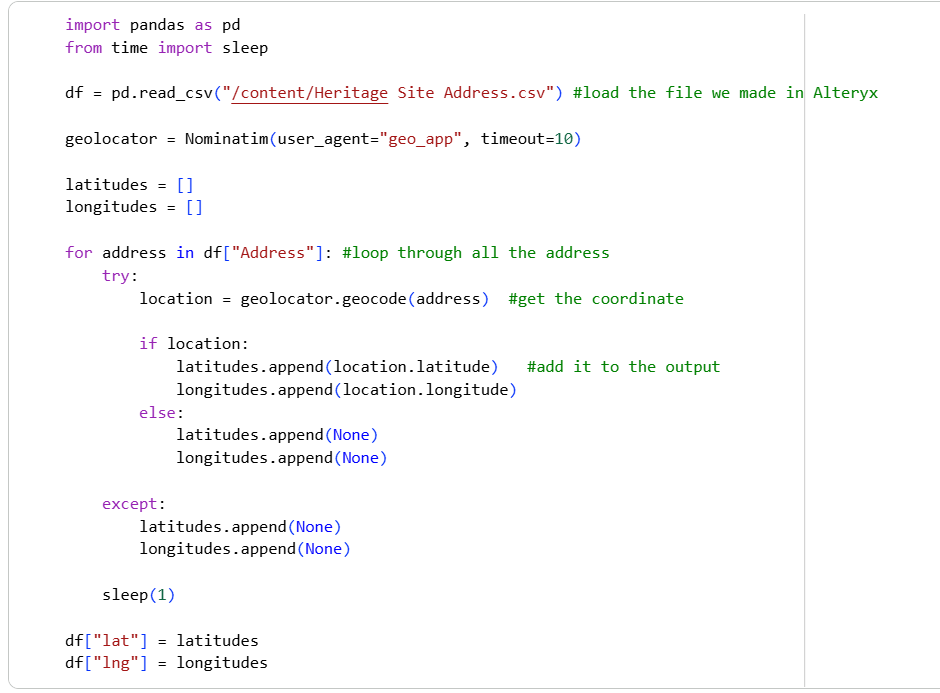
In this example, we tested the code using the address for Albany City Hall, and now that we know it is working, the next step is to scale the process. The goal is to iterate through the full list of heritage sites and generate coordinates for each one.
In the code below, we loop through the table we created in Alteryx and retrieve the coordinates for each address.
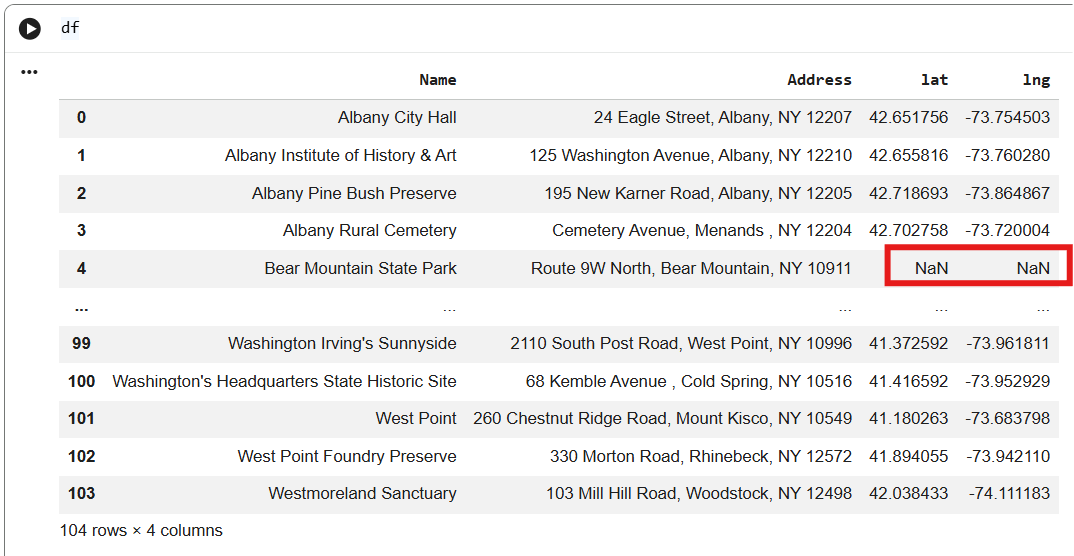
The output is shown below, and you can see that there are some null values in the coordinates.
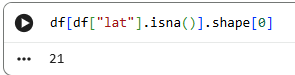
You can see below that 21 of the 104 addresses was not found using geopy.
Let’s take a closer look at the addresses where geopy was unable to find the coordinates.
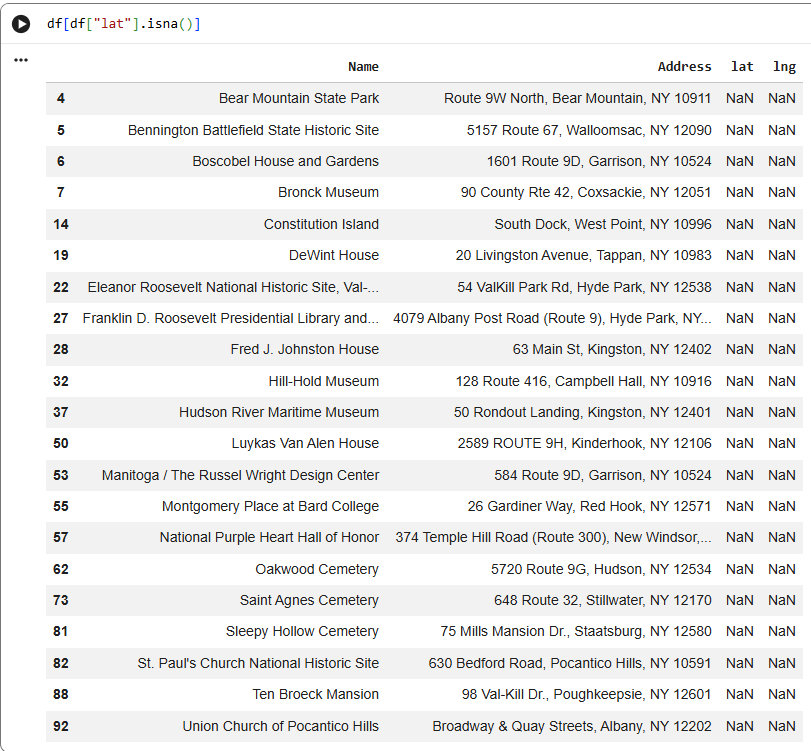
You can see where geopy couldn’t find the coordinates, which highlights one of the limitations of this approach. This typically happens when addresses are incomplete, inconsistently formatted, or not recognized by the geocoding service. It can also occur if the location is too vague or missing from OpenStreetMap’s dataset.
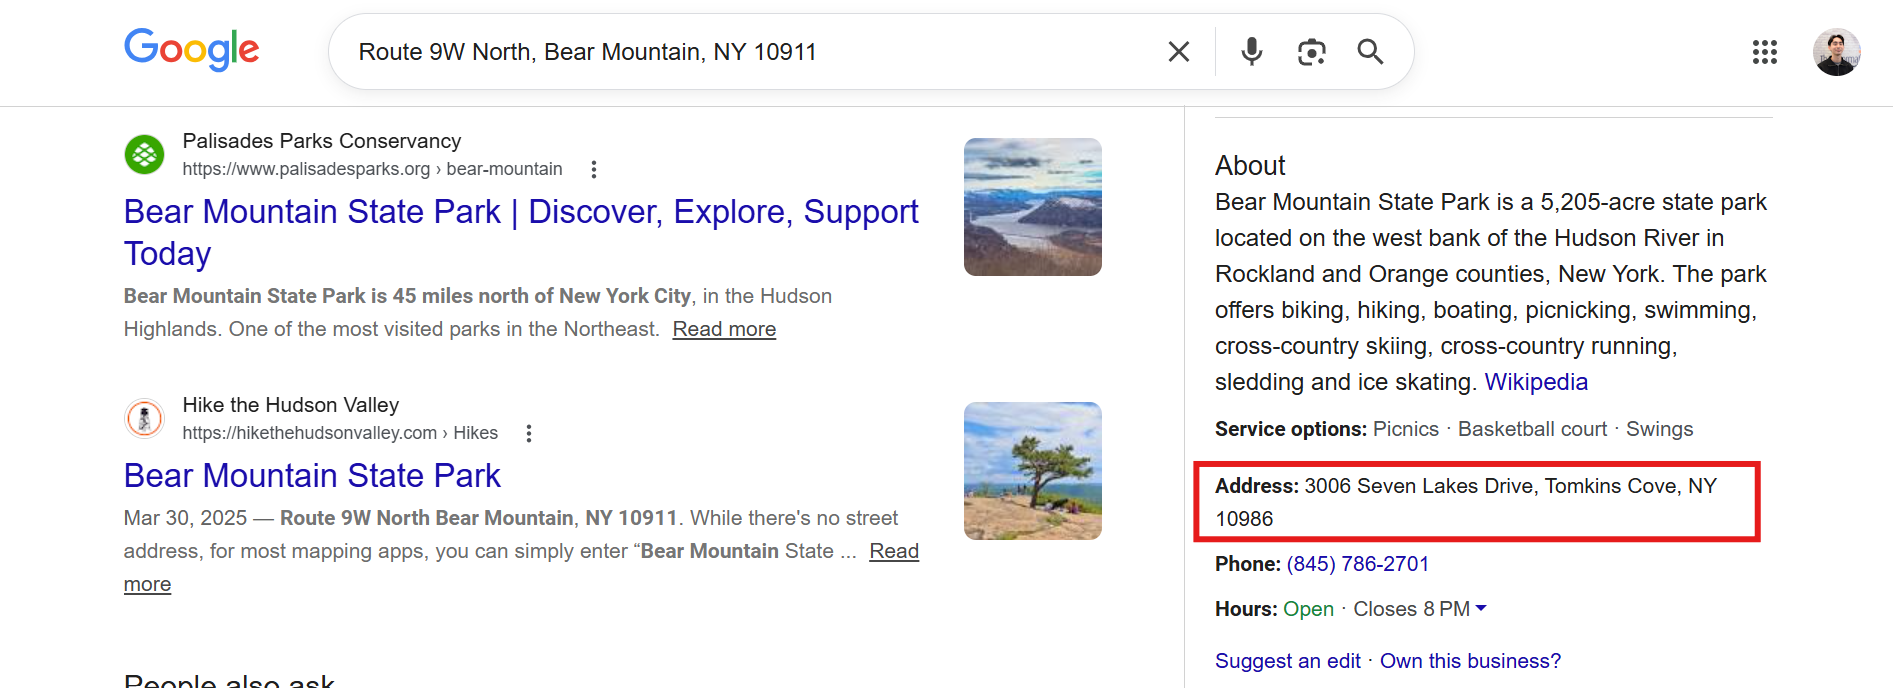
For example, take the address for Bear Mountain State Park: “Route 9W North, Bear Mountain, NY 10911.” When searching this in Google Maps, you may notice that Google sometimes displays a slightly different or more standardized version of the address. This is normal, as Google often cleans and standardizes location data using multiple sources, and it may prioritize the most recognized or precise geographic representation of the site rather than the exact input format.
In contrast, geopy—when used with the Nominatim service—relies on OpenStreetMap data, which does not perform the same level of advanced address interpretation or correction. This means it does not “search the web” in the way Google does, but instead matches the input directly against existing map data. As a result, it is less forgiving of ambiguous or inconsistently formatted addresses, which can lead to missing or null coordinates.
If you want to improve matching rates, a more robust geocoding service such as the Google Maps API can be better at interpreting and standardizing imperfect address inputs, although it may come with usage costs. For this analysis, we will not go into how to obtain perfectly standardized addresses, but that is typically a data-cleaning step required for some entries.
Once you obtain the coordinates, you can export the table like below.

And now the dataset is ready to be plotted in Tableau!
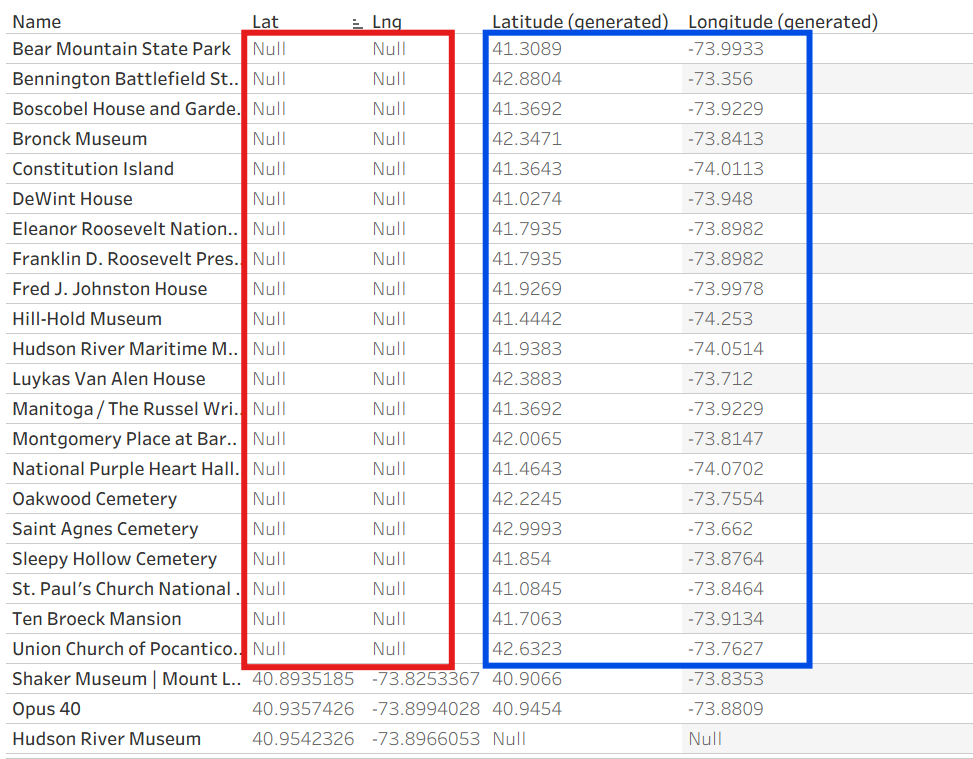
One additional step to address the missing rows is to use zip codes as a fallback, which was part of the original addresses. Tableau can recognize and geocode zip codes directly, we can extract the zip code from the address field and use it as an alternative location point for records where latitude and longitude are missing. This helps reduce data loss and ensures that more heritage sites can still be represented spatially, even if their full street address could not be geocoded.
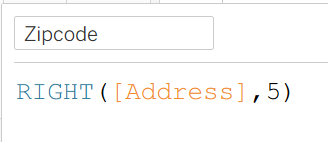
You can do this directly in Tableau by creating a calculated field to extract the zipcode from the address field, as shown below.
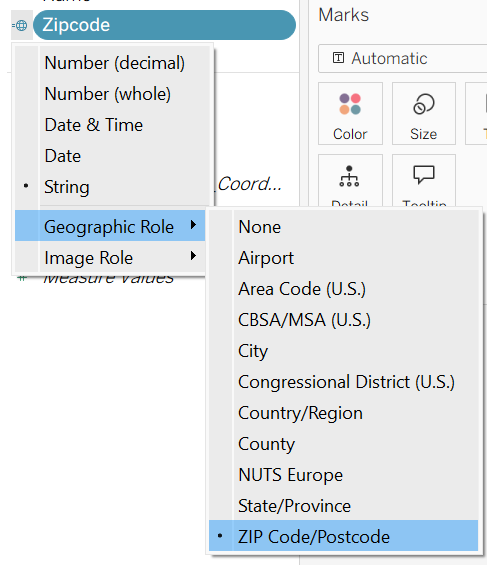
Then assigning it a geographic role.
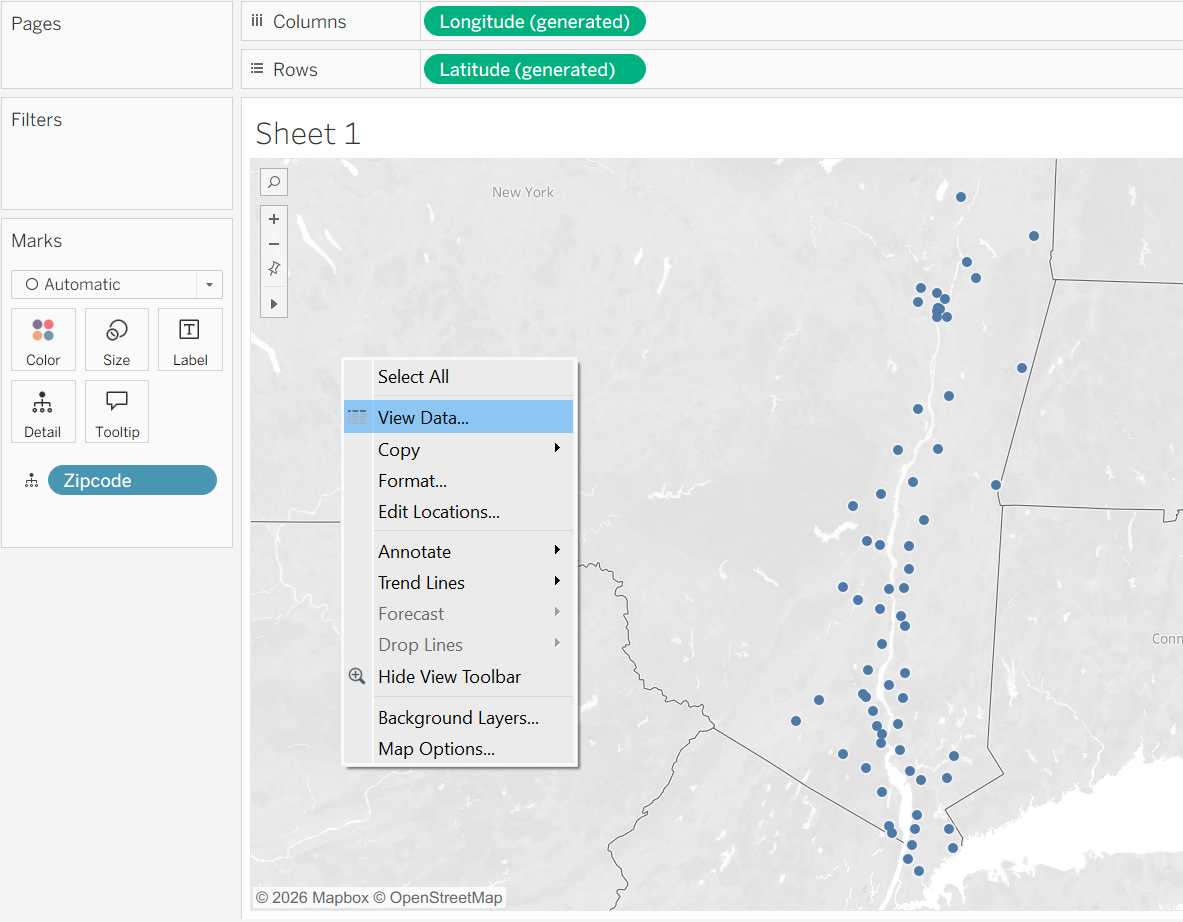
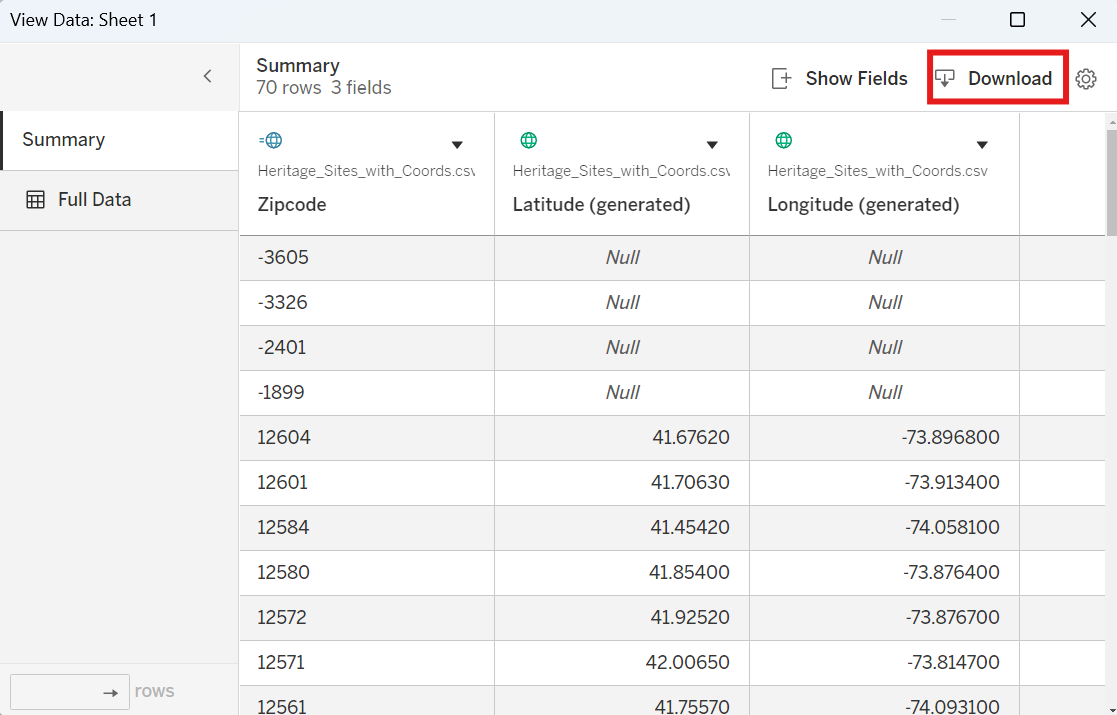
And once you plot it, you can view the data and download the generated latitude and longitude points.
You may notice that some of the zip codes are invalid or less precise at the point level, but this approach still helps fill in many of the missing locations compared to before.
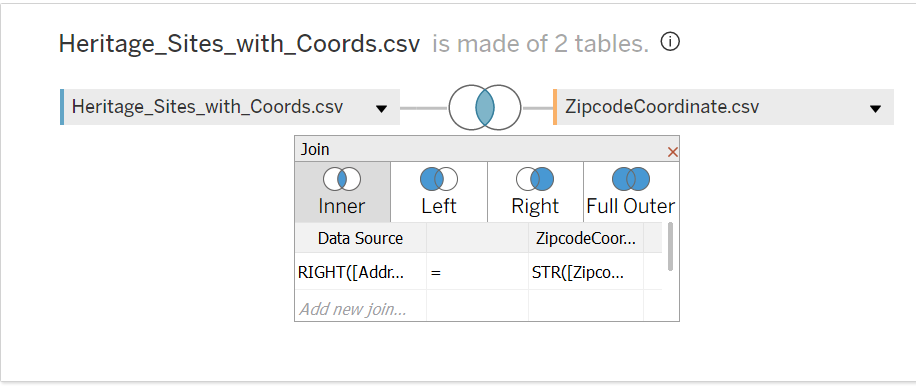
Finally, you can combine this newly generated dataset back to the original table:
And create a calculated field that uses the coordinates derived from the zip code as a fallback whenever the latitude and longitude from Python are null.
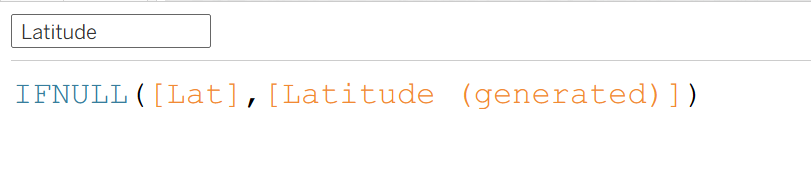
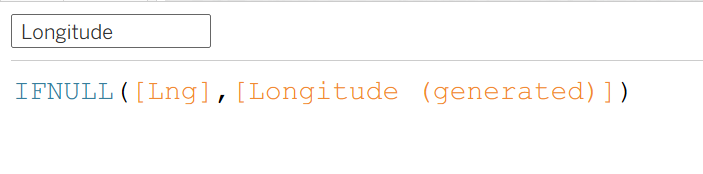
This ensures a more complete and consistent spatial dataset for analysis and visualization, under the assumption that latitude and longitude are either both successfully generated by geopy or both missing together (i.e., there are no cases where only one coordinate is returned).
Once plotted, this is how it looks like!
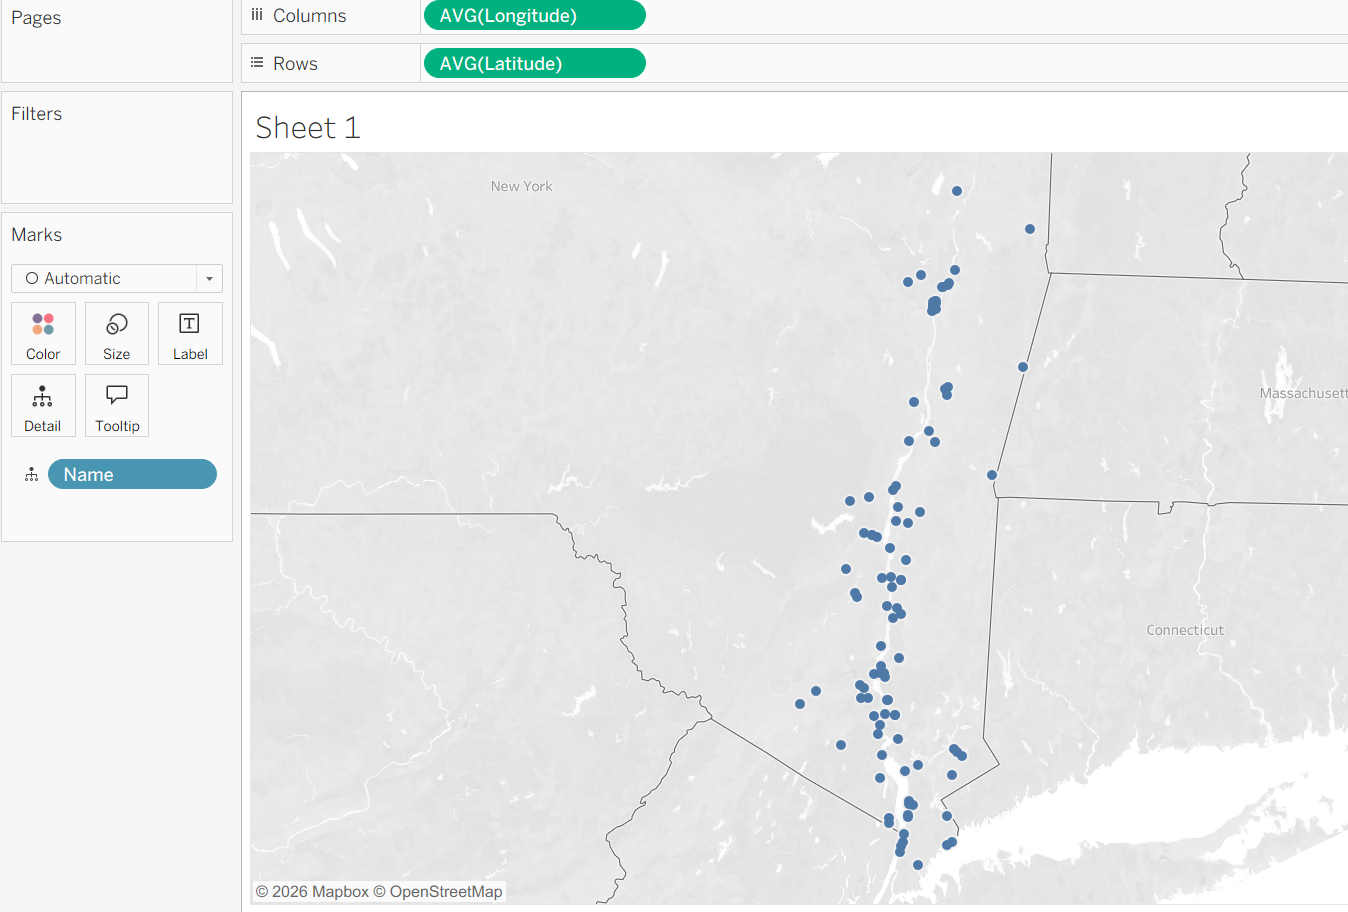
You can actually see that this method filled in all of the addresses that geopy couldn’t identify, meaning every heritage site is now represented on the map—either by its exact geographic coordinates or, when those were unavailable, by the centroid of its zip code!