


Another post about how to use parameters to dynamically change your view. This one is about Dynamic Zone Visibility (DZV).
DZV allows you to show or hide your sheets from the dashboard depending on the value of the parameter.
Like my last blog I will guide this concept through an example, using data from sample superstore. If you see filters on Country/Region, I have set it to only include United States.
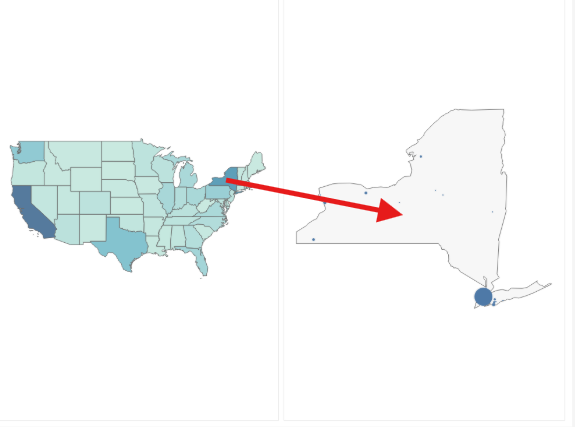
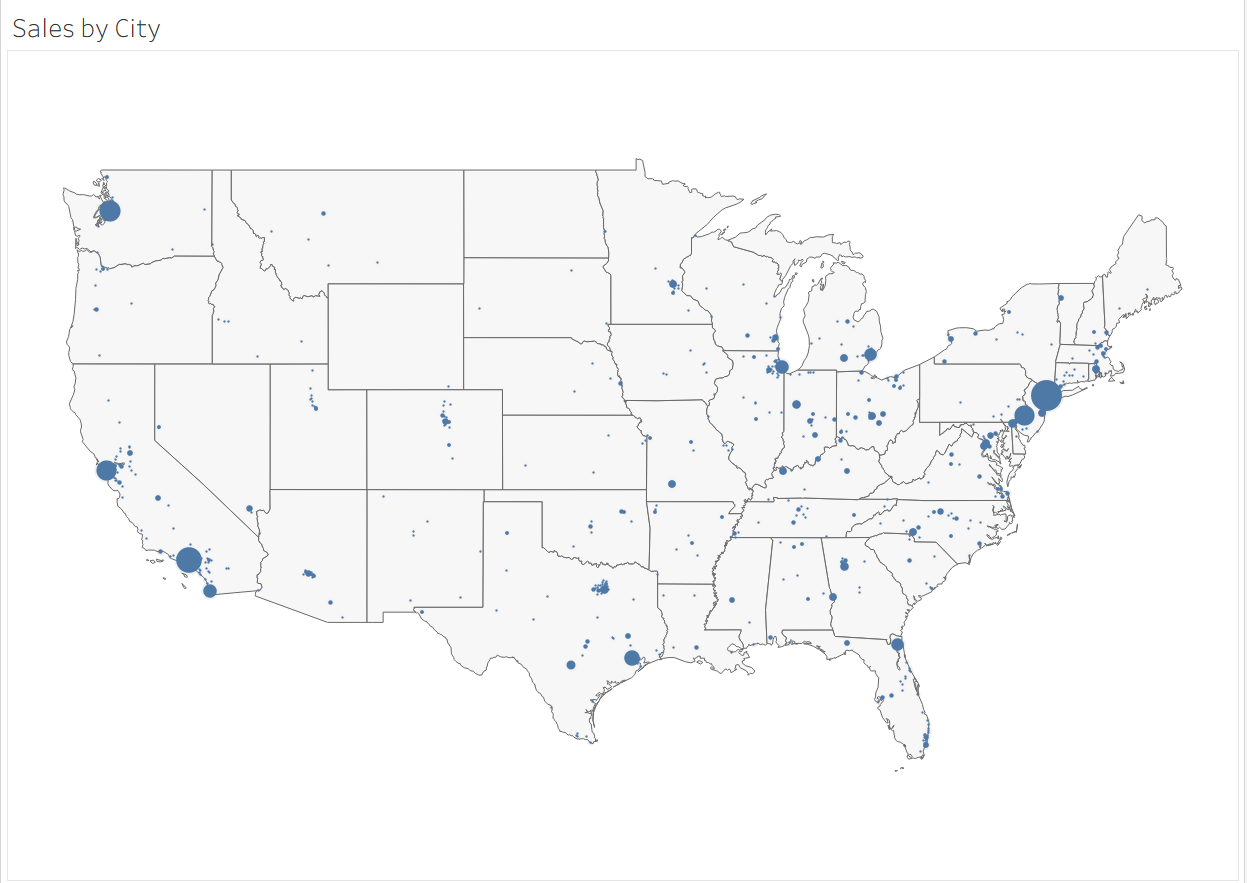
The goal of this example is to show a map where if you click on a state it will show you the sales of the cities within that state.
Lets get started!
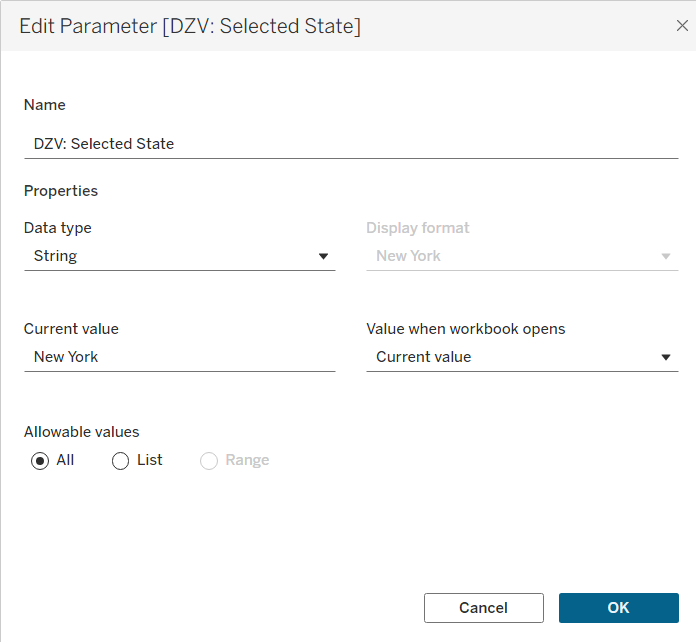
First, here are the parameters:
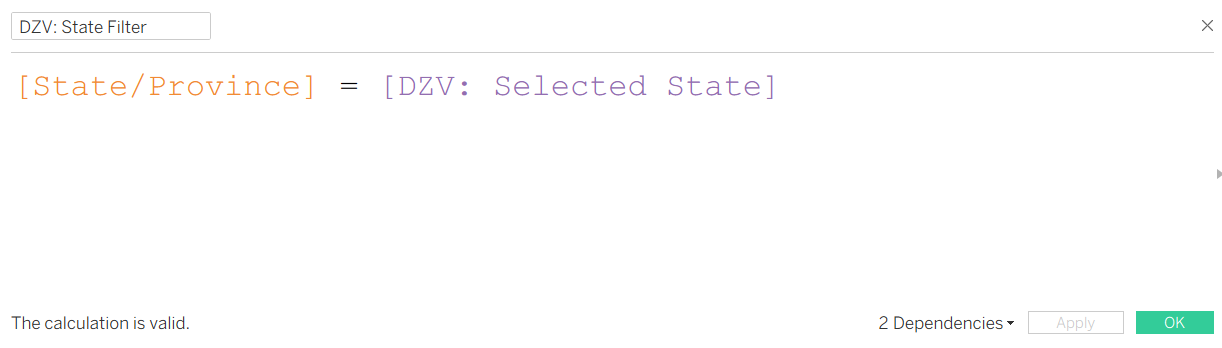
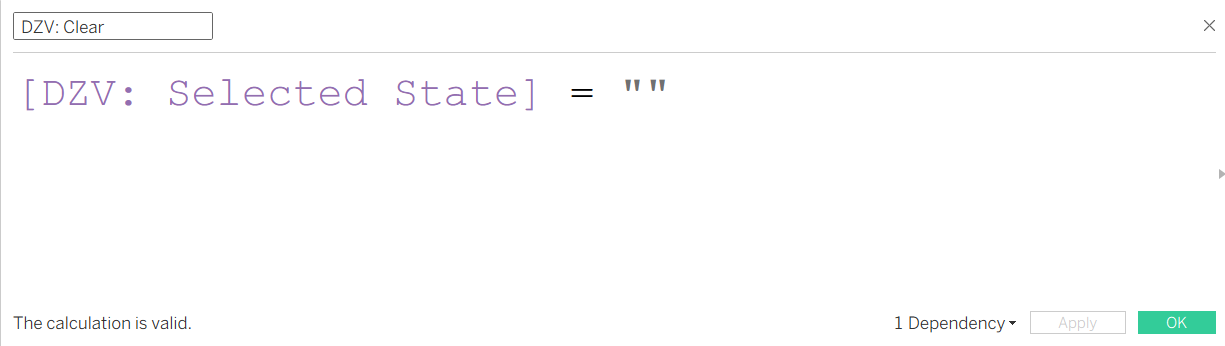
And the calculations:
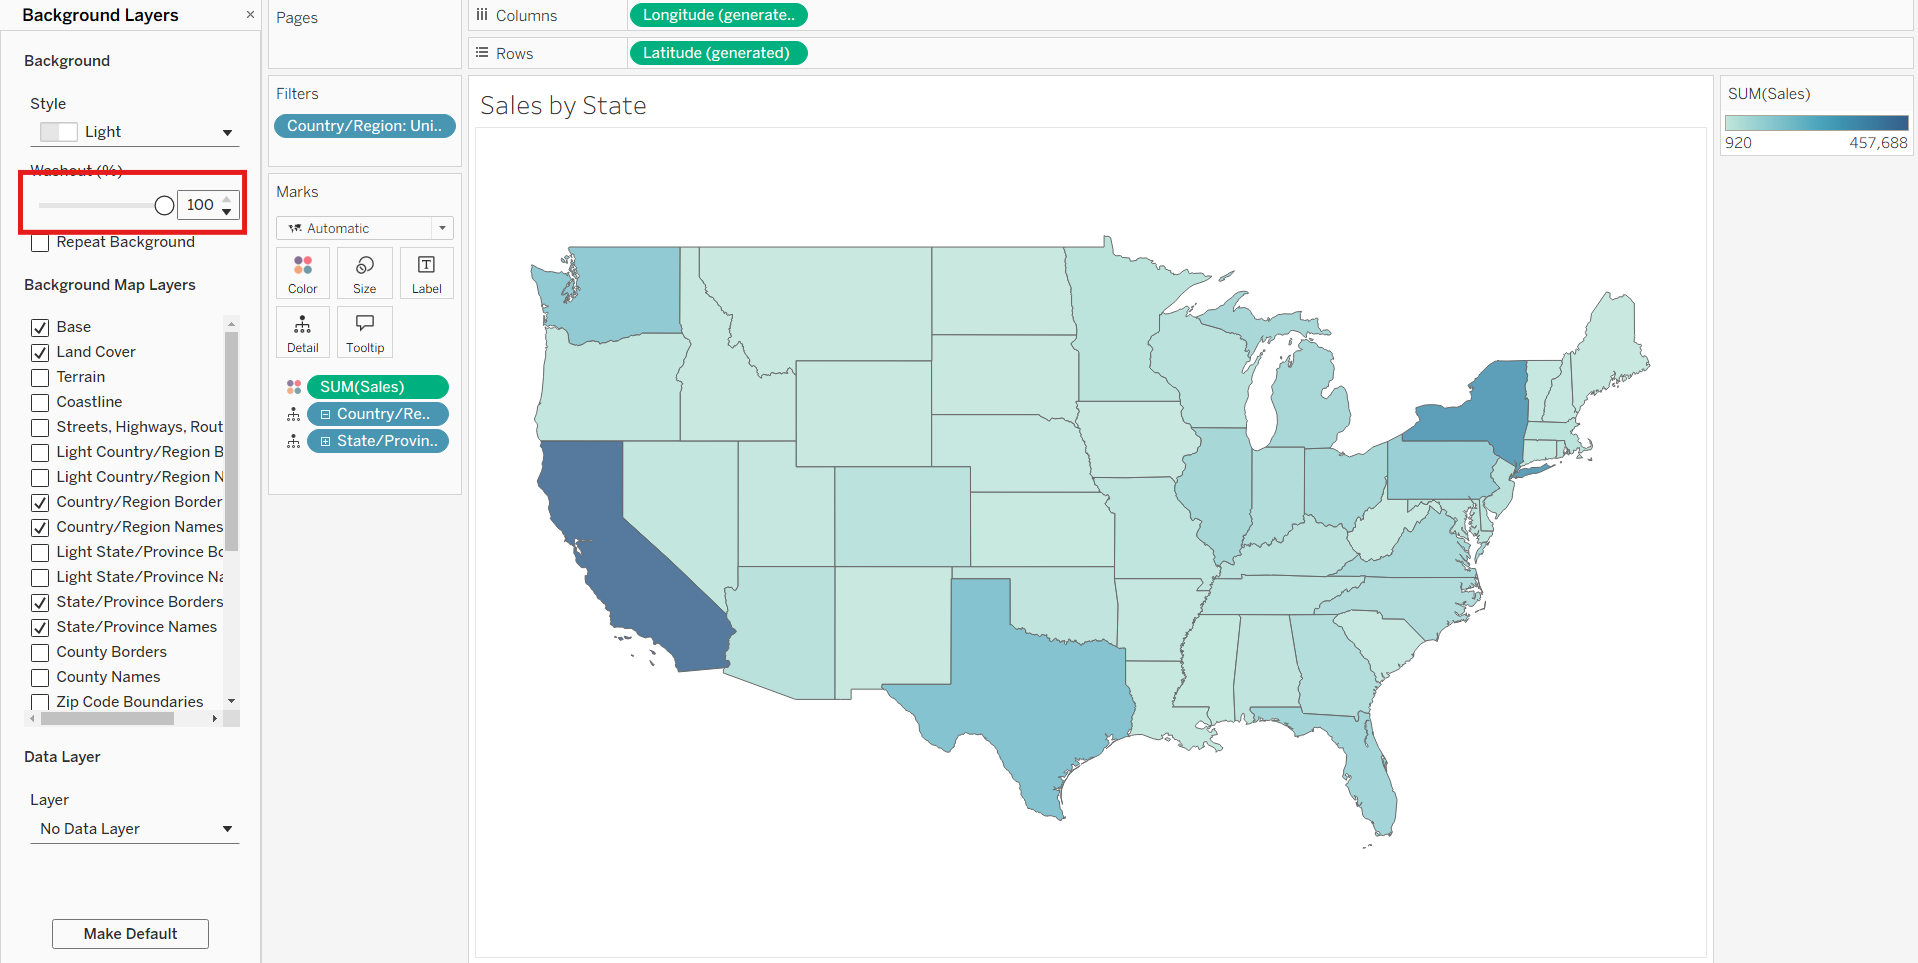
Start by making a sheet with the map of states colored by sales. You can make the background clean by making the washout to 100%.
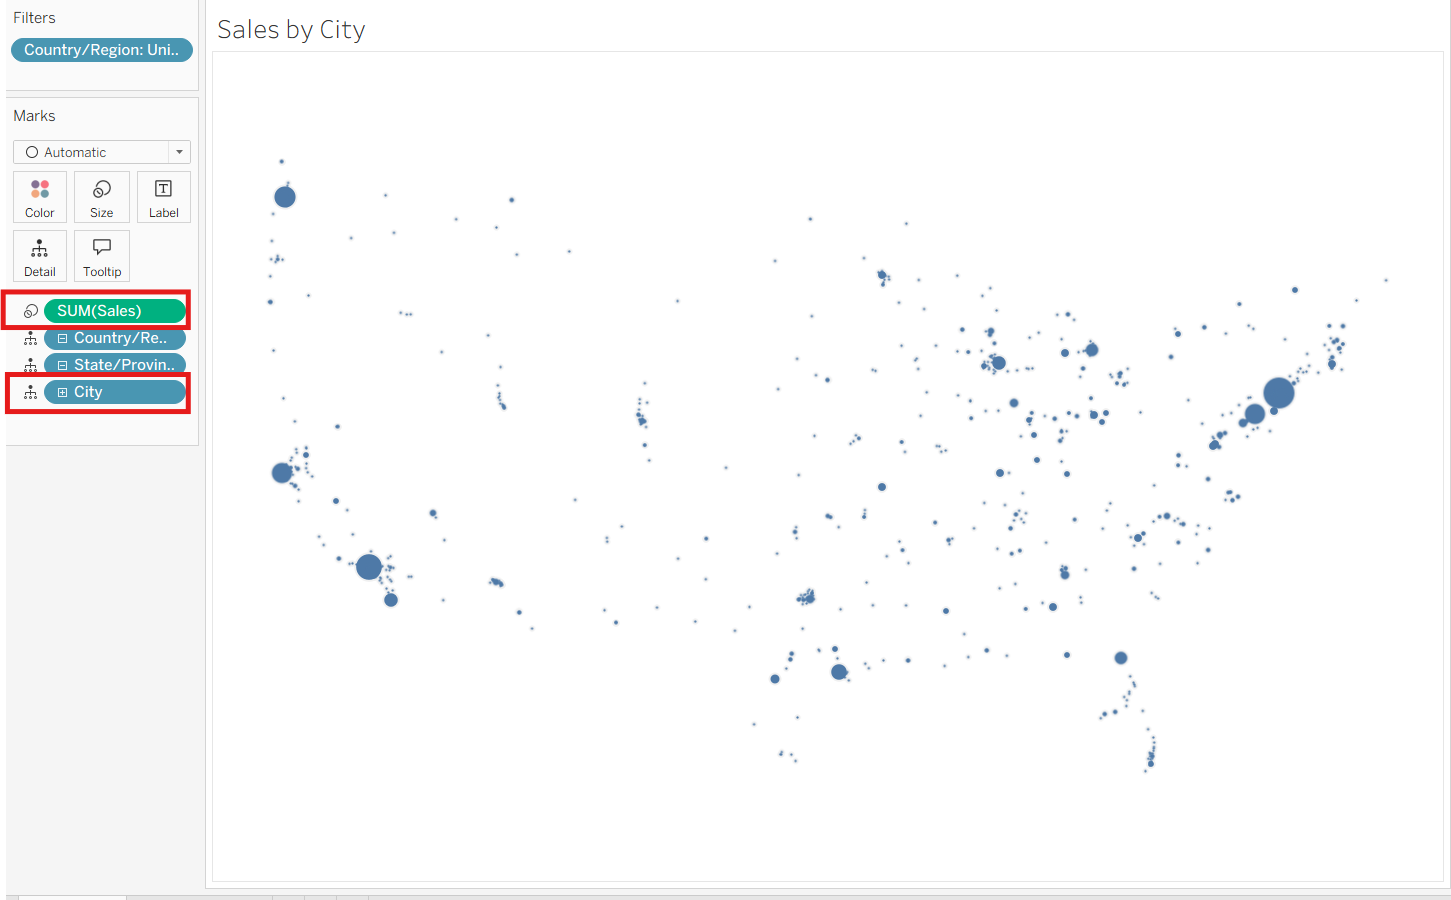
Duplicate the sheet and add City to detail, and change the sum of sales to size.
Right now there is no background of the map, so control drag the State field to a new marks layer....
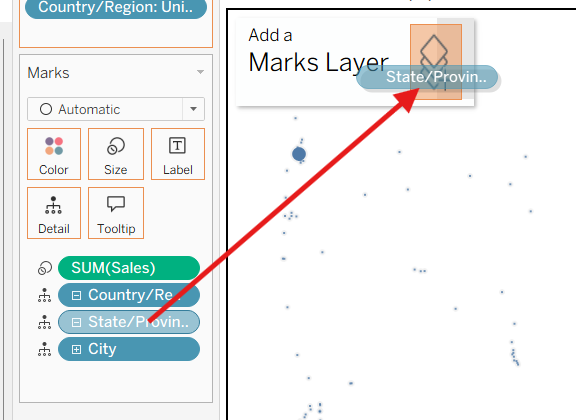
And change drag mark below Order.City, and change the marks type to Map. I like to change the color here to gray as well.
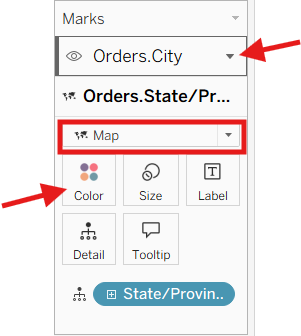
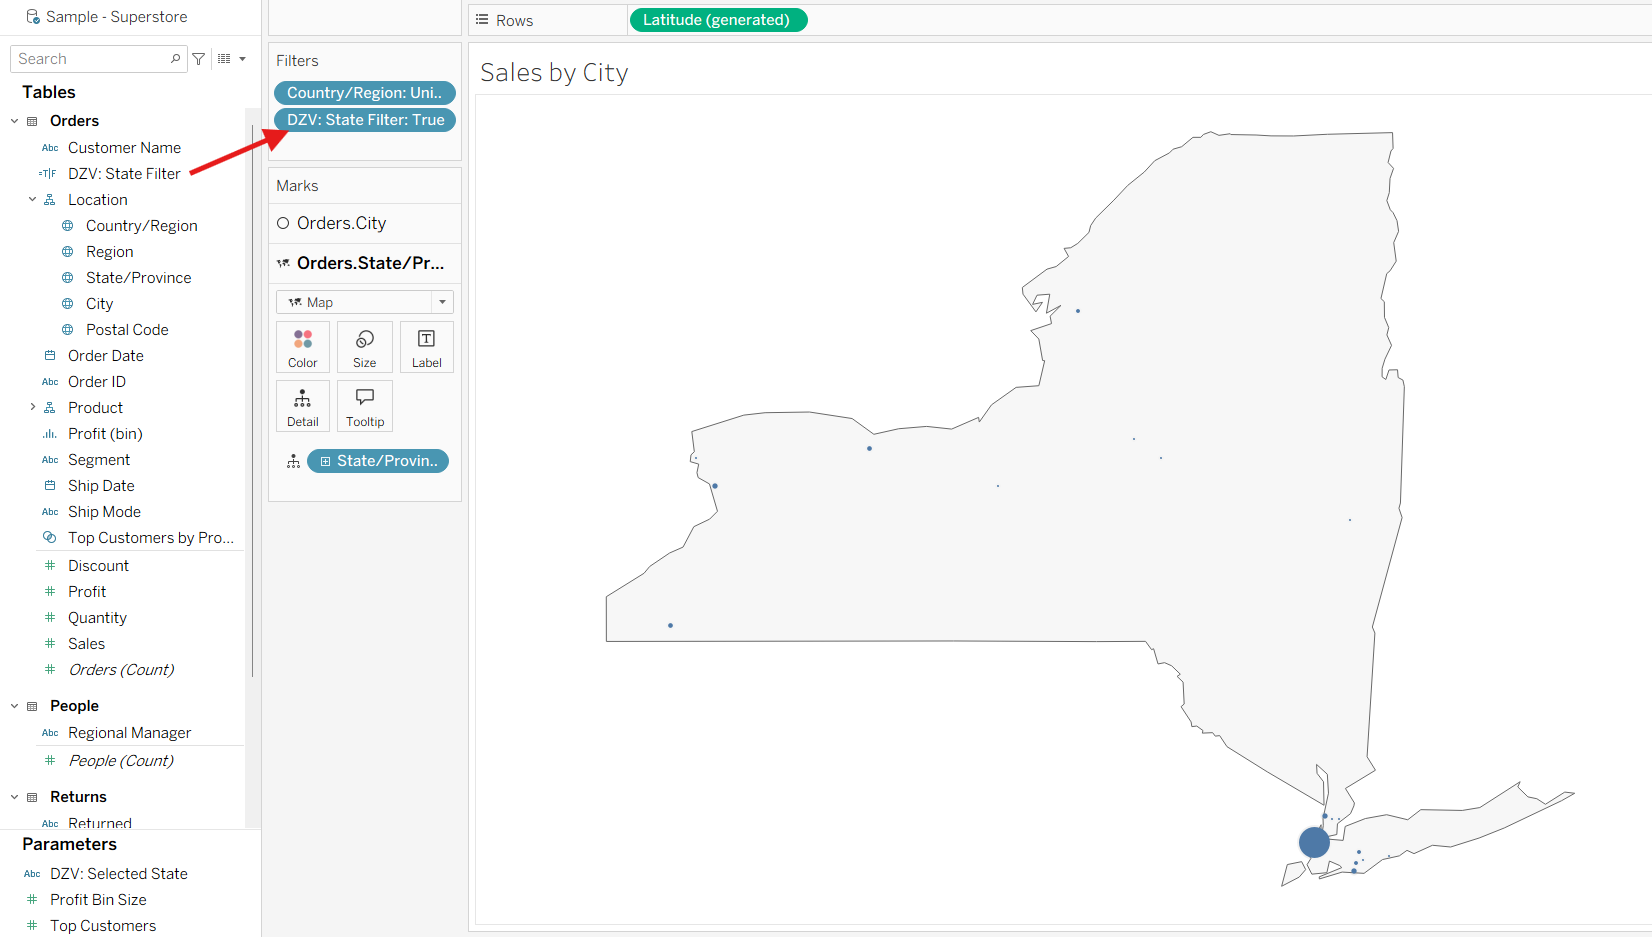
The sheet should look something like this.
Now, drag the DZV State Filter to the filter, and select True.
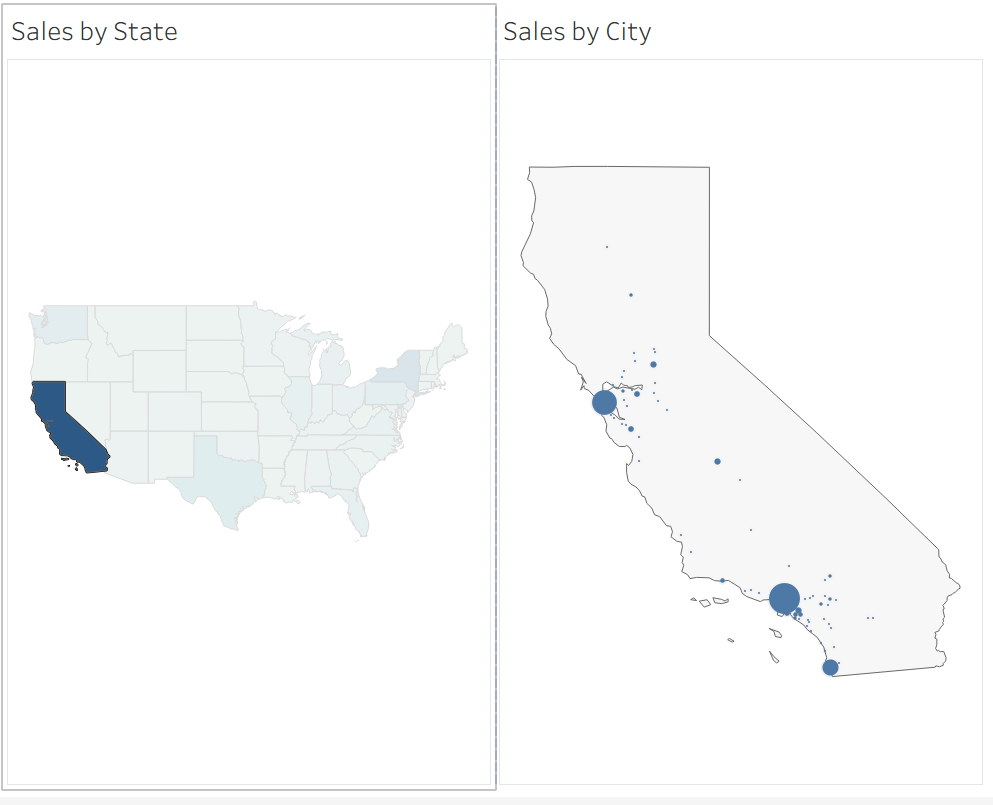
Great! Now if you show both sheets side by side on a dashboard, here is what it will look like:
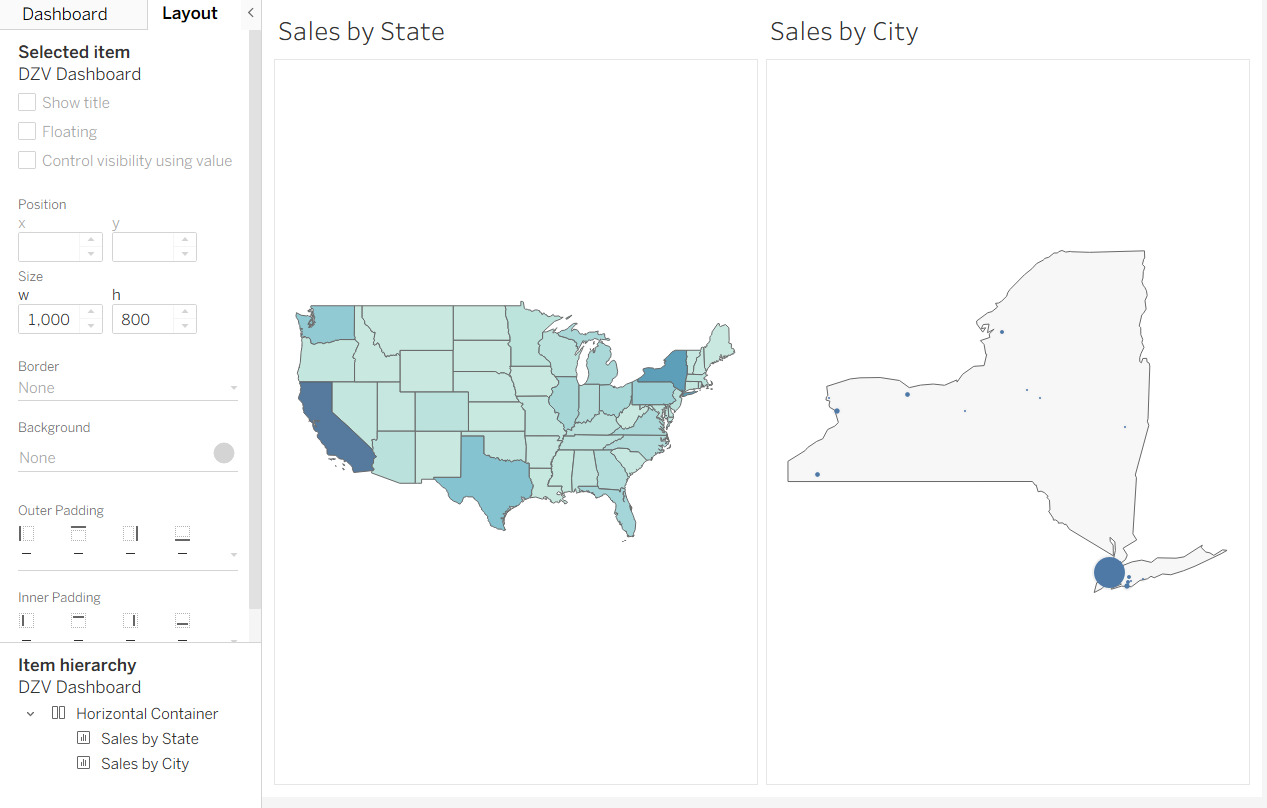
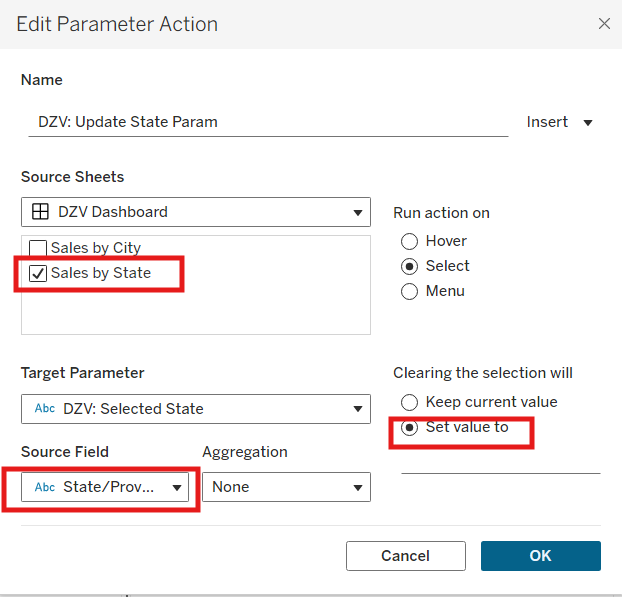
On this dashboard, add a parameter action shown below:
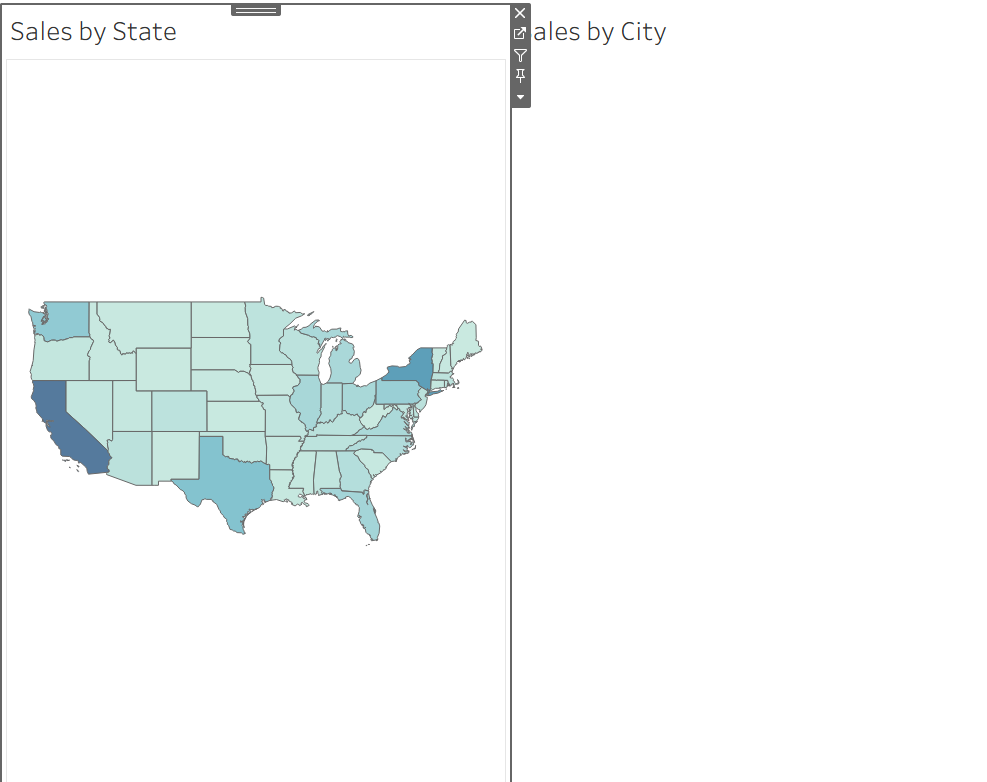
Now if you click a state on "Sales by State", the "Sales by City" will only show that state and cities within it!
If you click off a state (have nothing selected), the "Sales by City" will be empty.
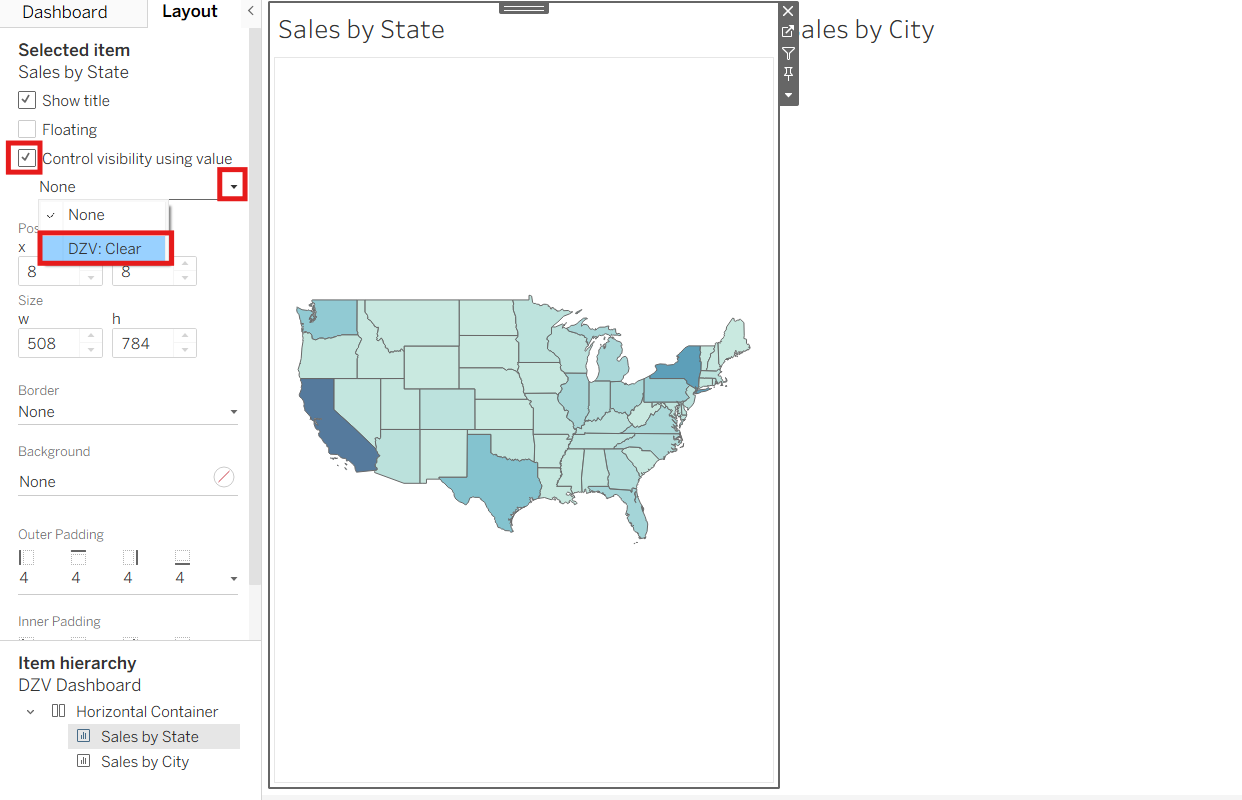
To add the DZV, select the "Sales by State" sheet and tick the "Control visibility using value", and set it to "DZV: Clear".
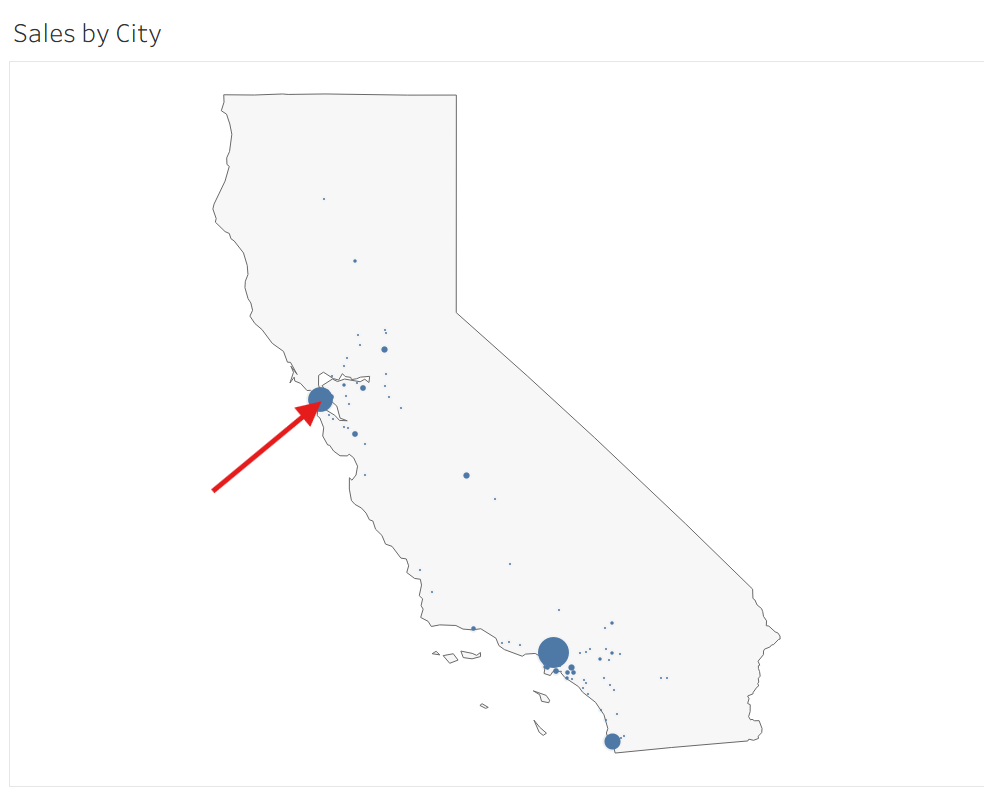
Now if you select a state, the big map will "Sales by State" sheet will disappear, and if you click on a city in the "Sales by City", the "Sales by City" sheet will disappear and "Sales by State" will come back again!
Here is the basic break down of the logic behind this interactivity:
- Selecting a state populates the "DZV: Selected State" parameter
- The "DZV: State Filter" will only return true for the state selected in "DZV: Selected State" parameter
- The "Sales by City" sheet is filtered by "DZV: State Filter", and will only show states selected by "DZV: Selected State" parameter
- Selecting a city will clear the selection of a State, which will set the "DZV: Selected State" parameter to ""
- When "DZV: Selected State" parameter is equal to "", "DZV: Clear" is True
- The visibility of "Sales by State" sheet is controlled by "DZV: Clear", meaning it will only show when it True
- Thus "Sales by City" will hide when a state is selected, and show when no state is selected
You can use DVZ to drill down multiple levels (ex. State -> City -> Zip code), and its a really useful tool for making your dashboard into an interactive and exploratory piece!
There are many other ways to use DZV, and it is not limited to Maps either, so I recommend looking around for other applications of this logic.