


Parameters in Tableau are variables that the user can change in order to control what is in view in a dashboard. They are useful for adding interactivity or for helping answer "what if?" questions.
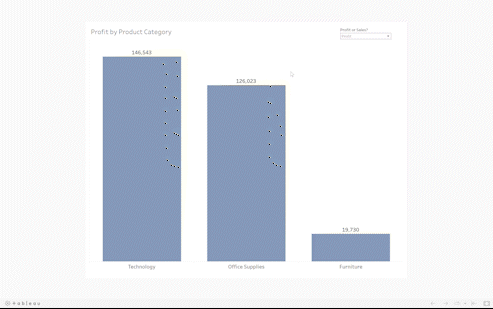
Below is an example of a parameter in action. The user is able to switch between viewing 'profit by product category' and 'sales by product category' on the same worksheet.
In this blog, I will demonstrate how to achieve this in Tableau Desktop.
1) CREATE PARAMETER:
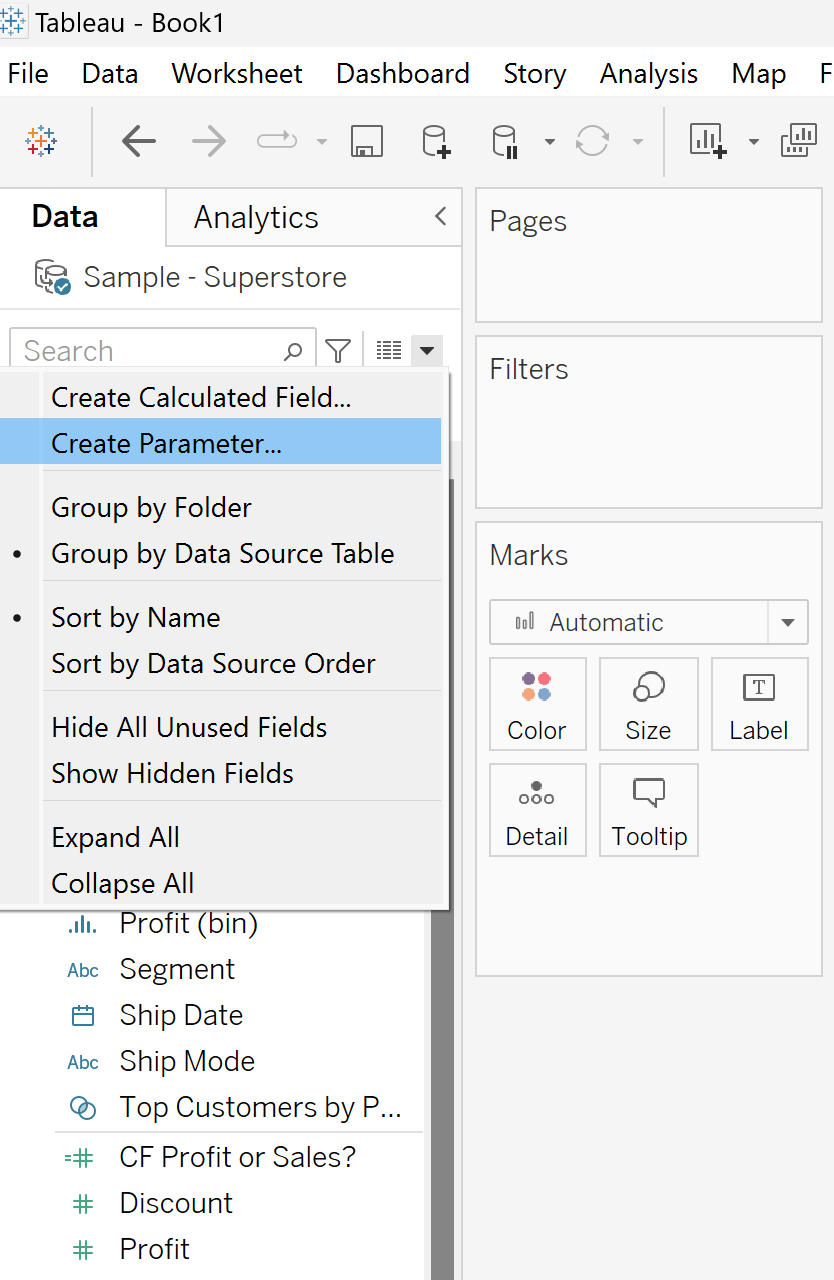
We first need to create the parameter. This can be done by clicking the arrow at the top of the data pane, followed by 'create a parameter', as shown below.
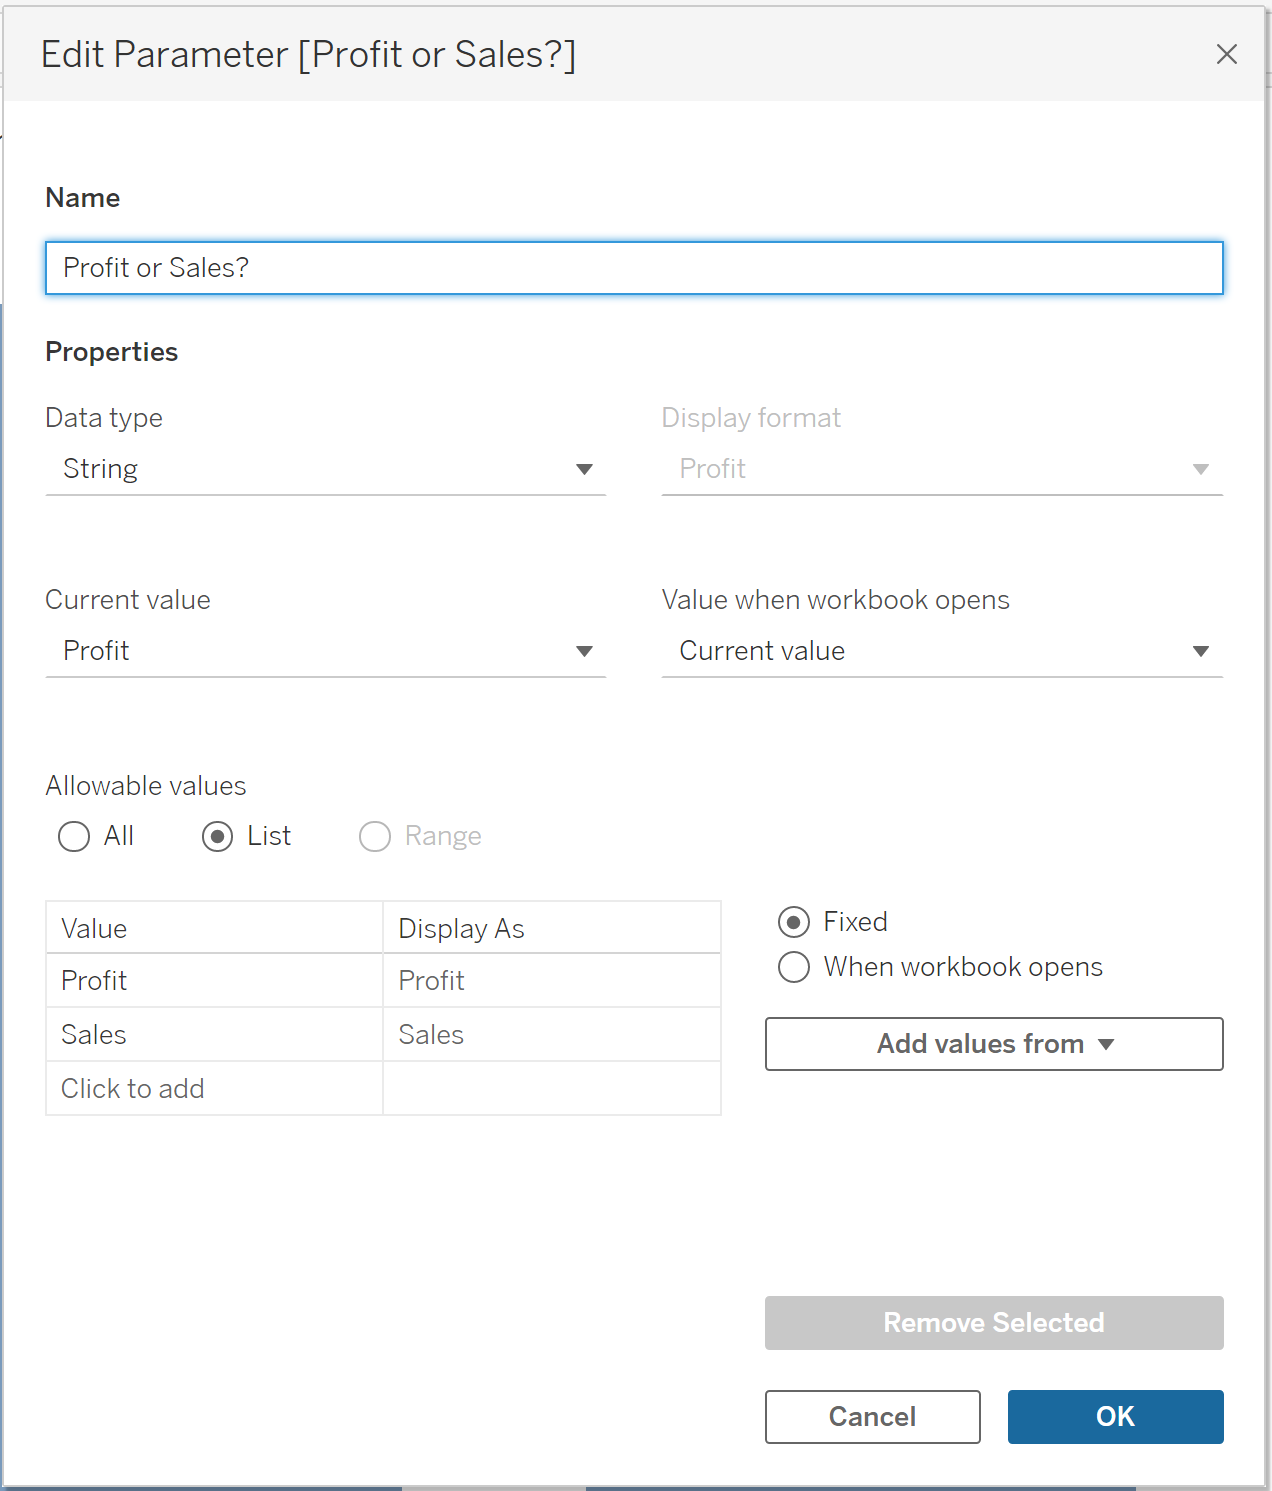
We then give the parameter a suitable name, select 'String' as our data type, and 'allowable values' to 'list'. Then type in the name of the fields you want to user to toggle in the table below, in this case, 'Profit' and 'Sales'. Then click 'OK'.
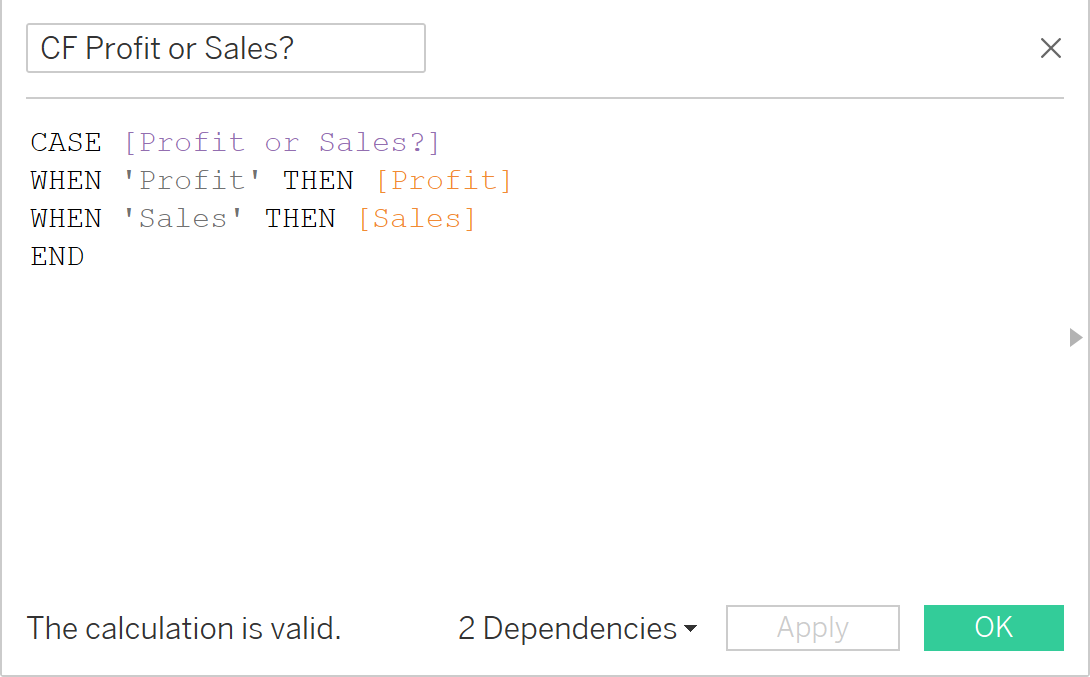
2) Create the following calculated field: a parameter without a corresponding calculated field is useless. In order to allow the user to control the sheet, we need to create a calculated field referring to the parameter we made earlier.
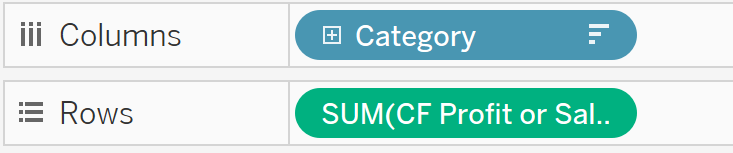
3) We then need to drag this calculated field onto the row shelf:
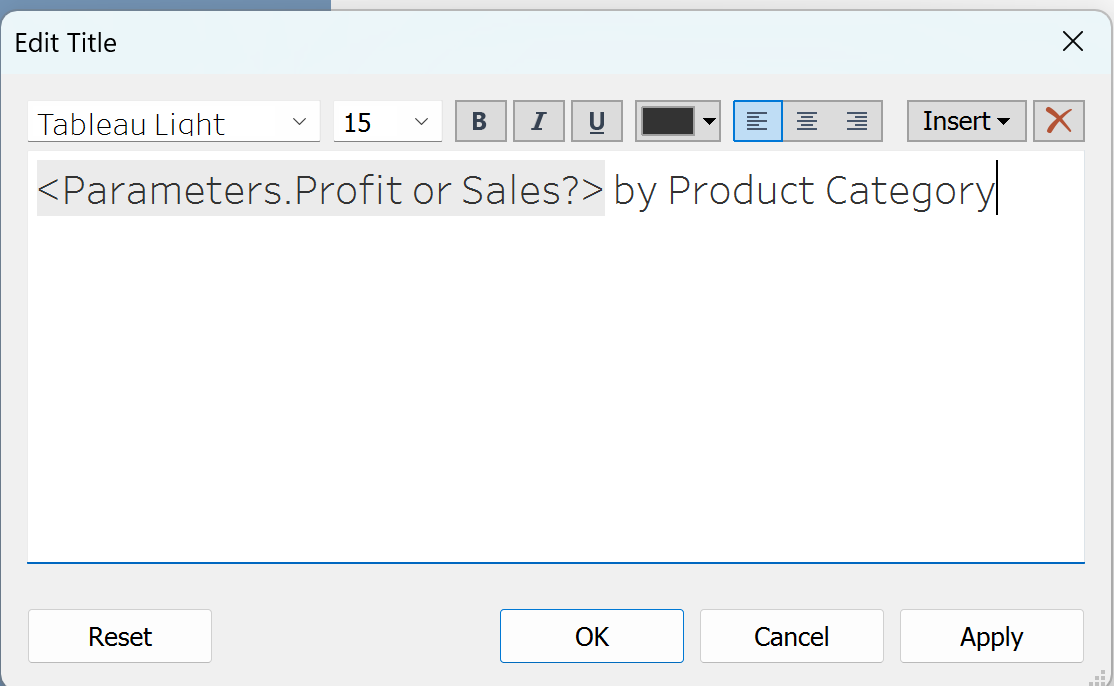
4) The final step is to edit our title so that the title of the sheet adjusts as the user changes the parameter value (you may need to edit the parameter values or title wording so that it makes sense).
And that is it! There was a high-level example of how you can easily use parameters to add interactivity to your dashboards in Tableau. Stay tuned for Tableau Desktop tutorials.