


Hi folks. The four month training period at the Data School is over. Why not review some of the personal highlights during the program. In the following I will present three pieces of work that emerged in that time.
- Dashboard Week Day 1 - 20 Years Bundesliga
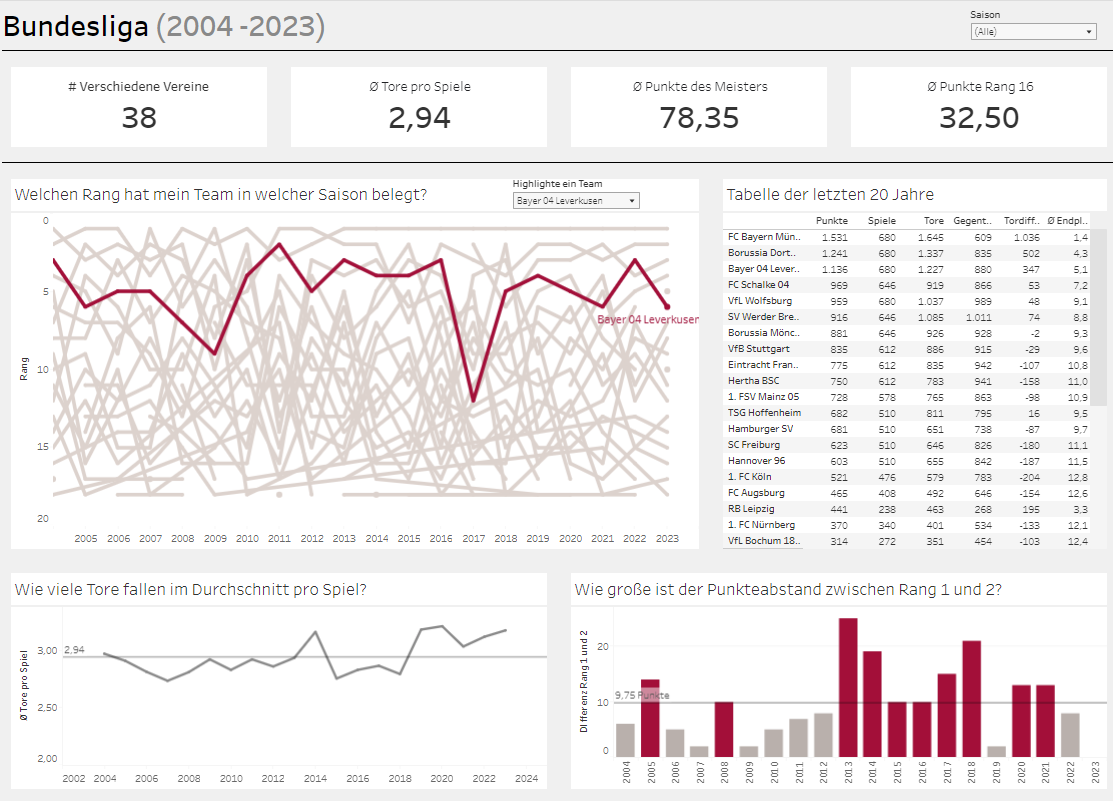
For this dashboard I had to go the full circle. First, I had to webscrape the data and prep it in Alteryx. Second, I had to sketch the dashboard. Last but not least, I had to build the dashboard in Tableau. It felt like building a complete car and not just to mount the wheels. It also did not hurt that I am a sports enjoyer and played football myself for 14 years. All in all, a blast of a project.
2. Podcast: Freakonomics in Zahlen
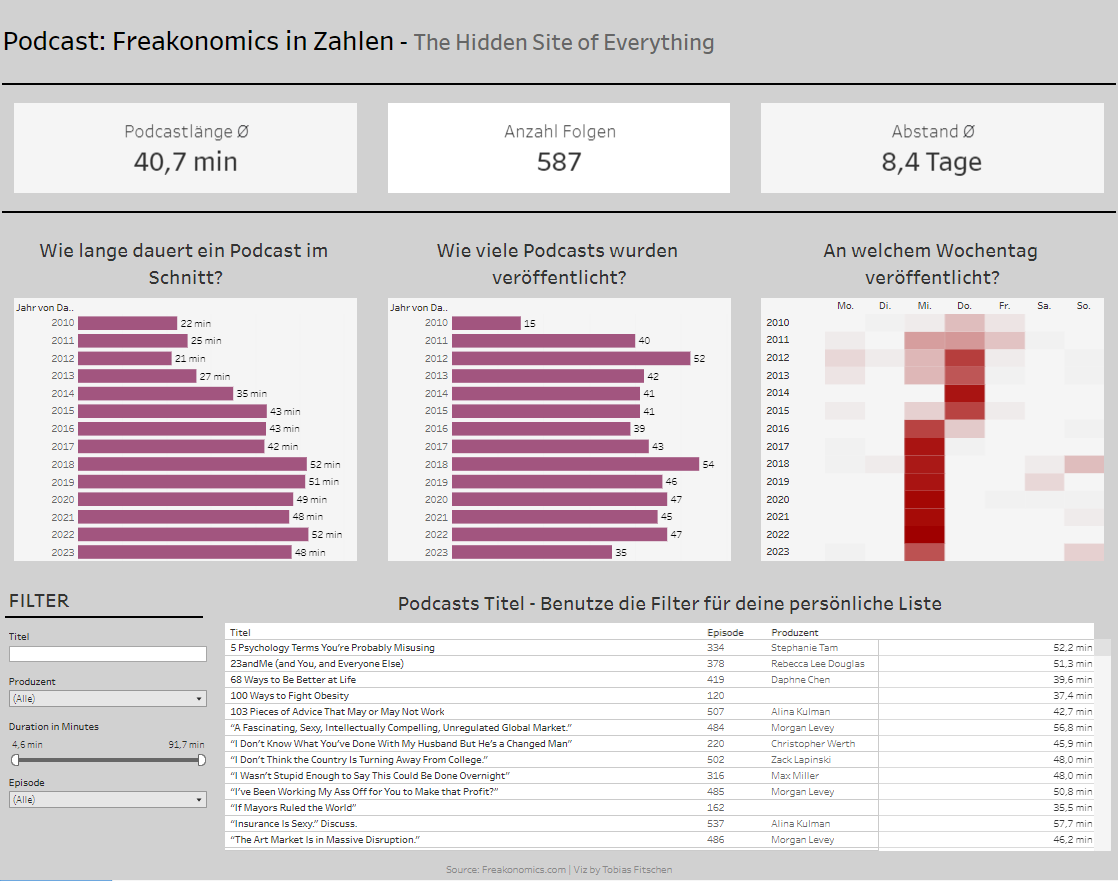
For this dashboard I had to go the full circle again. Maybe you see a pattern here!? First, I downloaded the data of my favorite podcast from the internet. Second, I wanted to build a dashboard that informs about the podcast, but which also allows you to find a podcast that might be interesting for you.
3. Client Project: Power BI
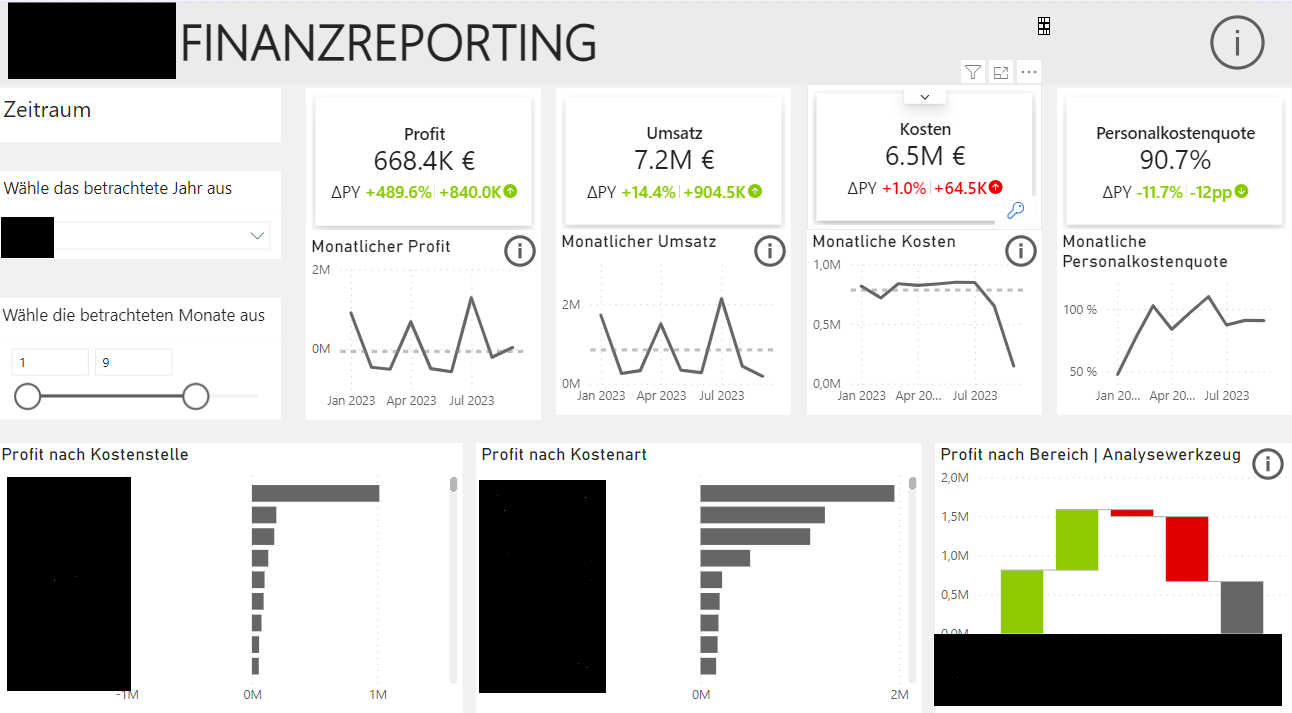
After a total of just one week Power BI training we got our first Power BI client project. What I like about the dashboard the most is the drill down which allows you to do some deep analysis and to use the insights for real life actions. The dashboard is made unregocnizable to preserve the anonymity of the client.
What do all the shown dashboards have in common? They are interactive and have a purpose. On to the next project. Happy vizzing!
Cheers, Tobias