


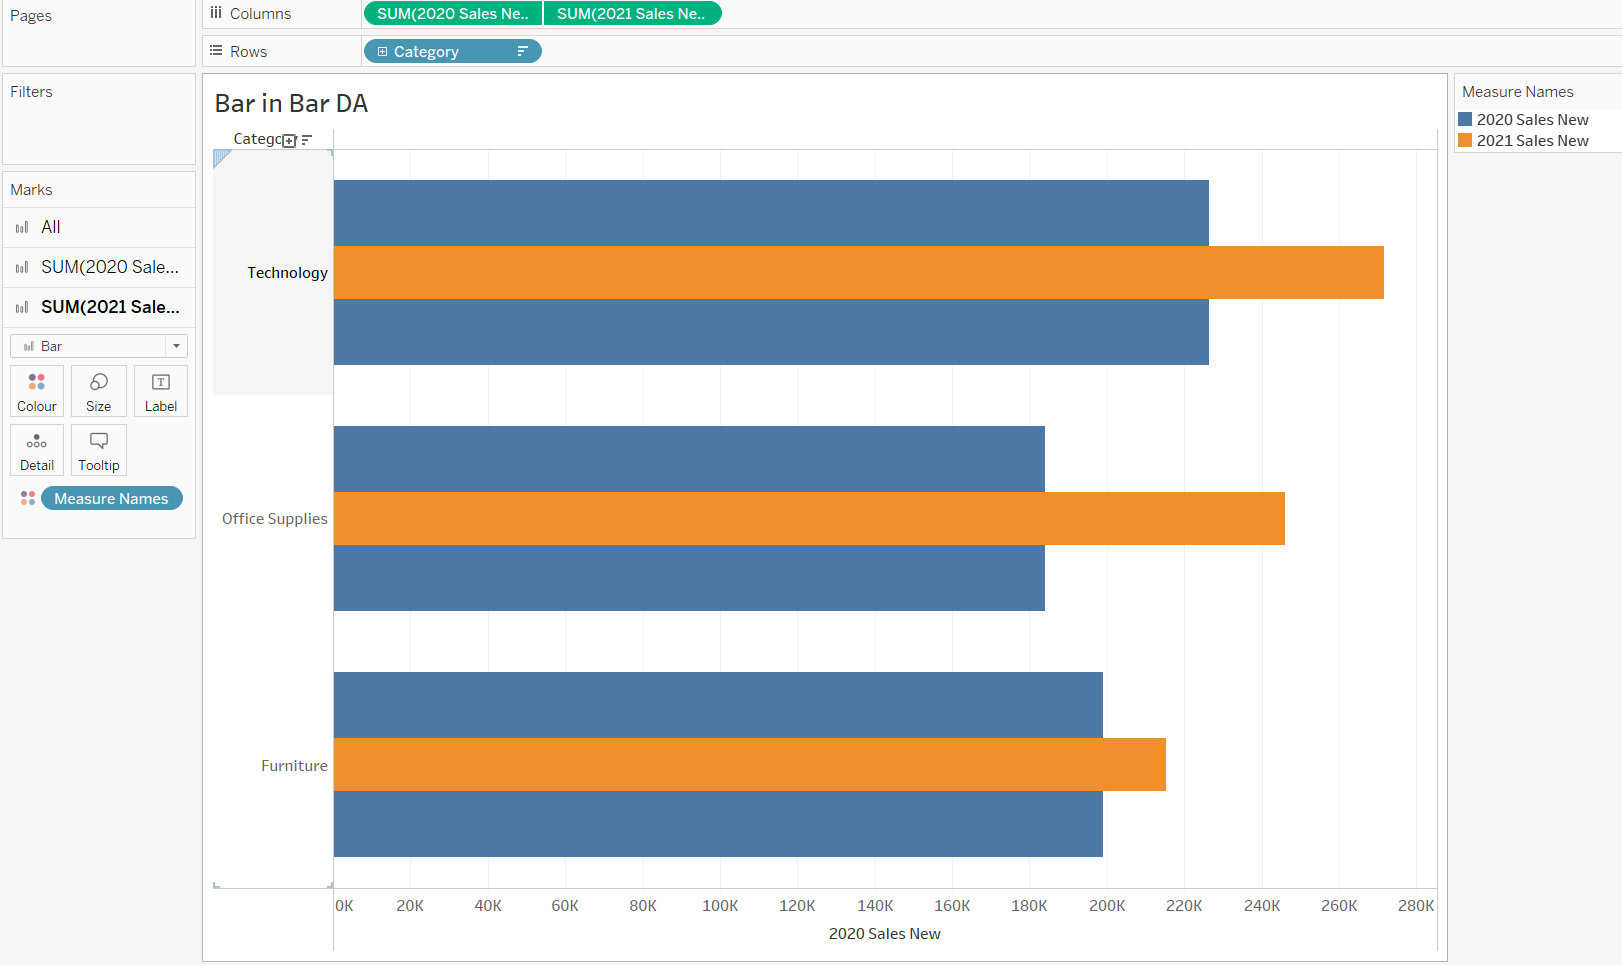
Right now the DSDE 5 cohort is about to finish week 3 and we already learned a lot about Tableau. So why not write something about the stuff we learned? Hence, this blog will describe how to visualize a bar in bar chart like the following:
Short version:
1. Drag a categorical variable into the rows field and drag two continuous variables into the columns field.
2. Right click on a variable in the columns field and select dual axis.
3. Change chart type to bar if it changed to circle or something else.
4. Synchronize axis and deselect show header for the axis at the top.
5. Adjust the bar size for one variable. Done!
Longer version:
First, you have to think about the variables you want to include. You need at least three. One categorical variable for the rows and two continuous variables for the bar charts that will overlap each other later.
The next step is to drag the categorical variable (blue field) into the rows field. Then you create the first bar chart by dragging a continuous variable into the columns field. For the second bar chart you drag the other continuous variable also into the columns field.

Now you go to the columns field and right click on the variable you just put into the columns field. In the menu you select dual axis and the two bar charts will now share the rows axis. Note that the chart type might have changed to circle or something. Do not worry and just select bar chart on the menu for all. The bar charts will share both axis if you right click on any x-axis and click synchronize axis.
At the moment you should have two identical x-axis. Right click on the x-axis at the top and deselect show header. Now we can already see the finish line. Last but not least, you need to adjust the bar size of one continuous variable. Beware to not select the all variable menu on the left. Changing the size in the all menu will affect both bar charts at the same time. Enjoy your bar in bar chart 😊
Cheers, Tobias