Calculating streaks in Tableau is something I have had some trouble with.
A streak is the number of consecutive times a condition is met.
Think of those x days since last y signs you may have seen before like this.

A while ago when attempting a Makeover Monday in a hour I wanted to implement a way to show streaks in my visualization. In the time frame of an hour I wasn't able to spend time on learning more about streaks in Tableau.
The data set includes different countries and their Alcohol Consumption in Litres per capita from 1960-2022. I thought it would be interesting to see how many years in a row a country reduced their Alcohol Consumption.
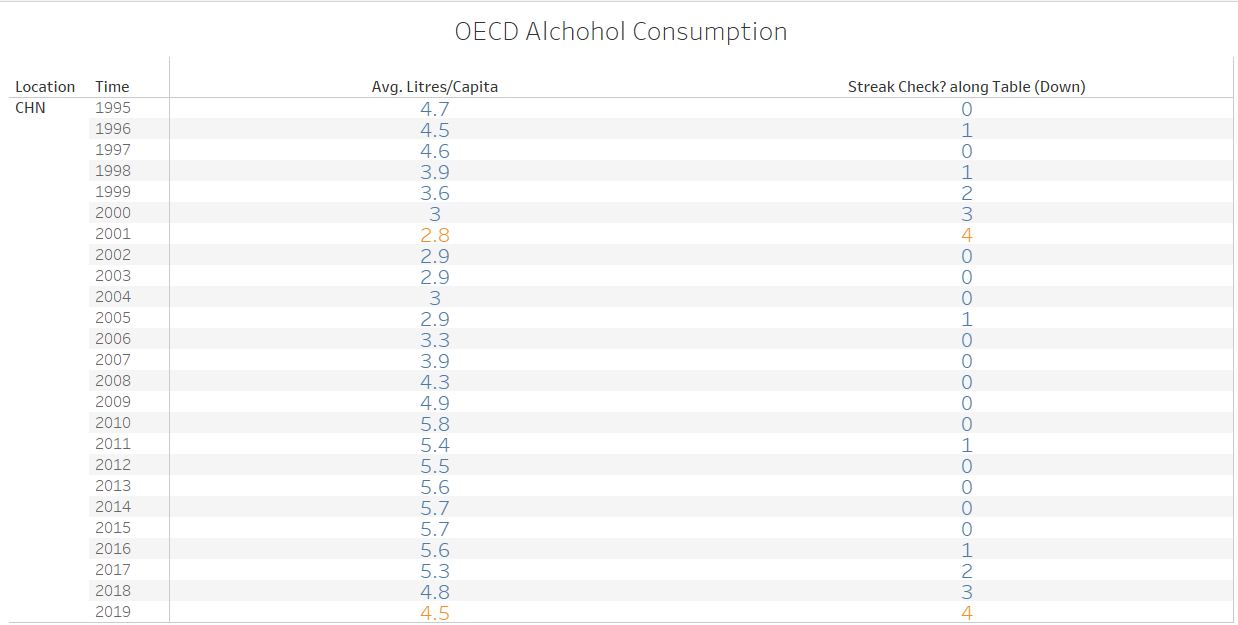
Here is a table showing what I was going for before I show you the calculation.

From 1998 to 2001 there was a steady decrease in Alcohol consumption compared to the previous year. Which increases the streak by 1 each time. In 2002 when the Avg Litres/Capita increases the streak is reset back to 0. I also highlighted the times when the streak is equal to the max streak.
Lets get into the calculation.

This calculation uses Lookup -1 to compare the previous value of Avg Litres/Capita to the current value then adds 1 to the previous value of the streak if that condition is met and resets to 0 if the condition is not met.
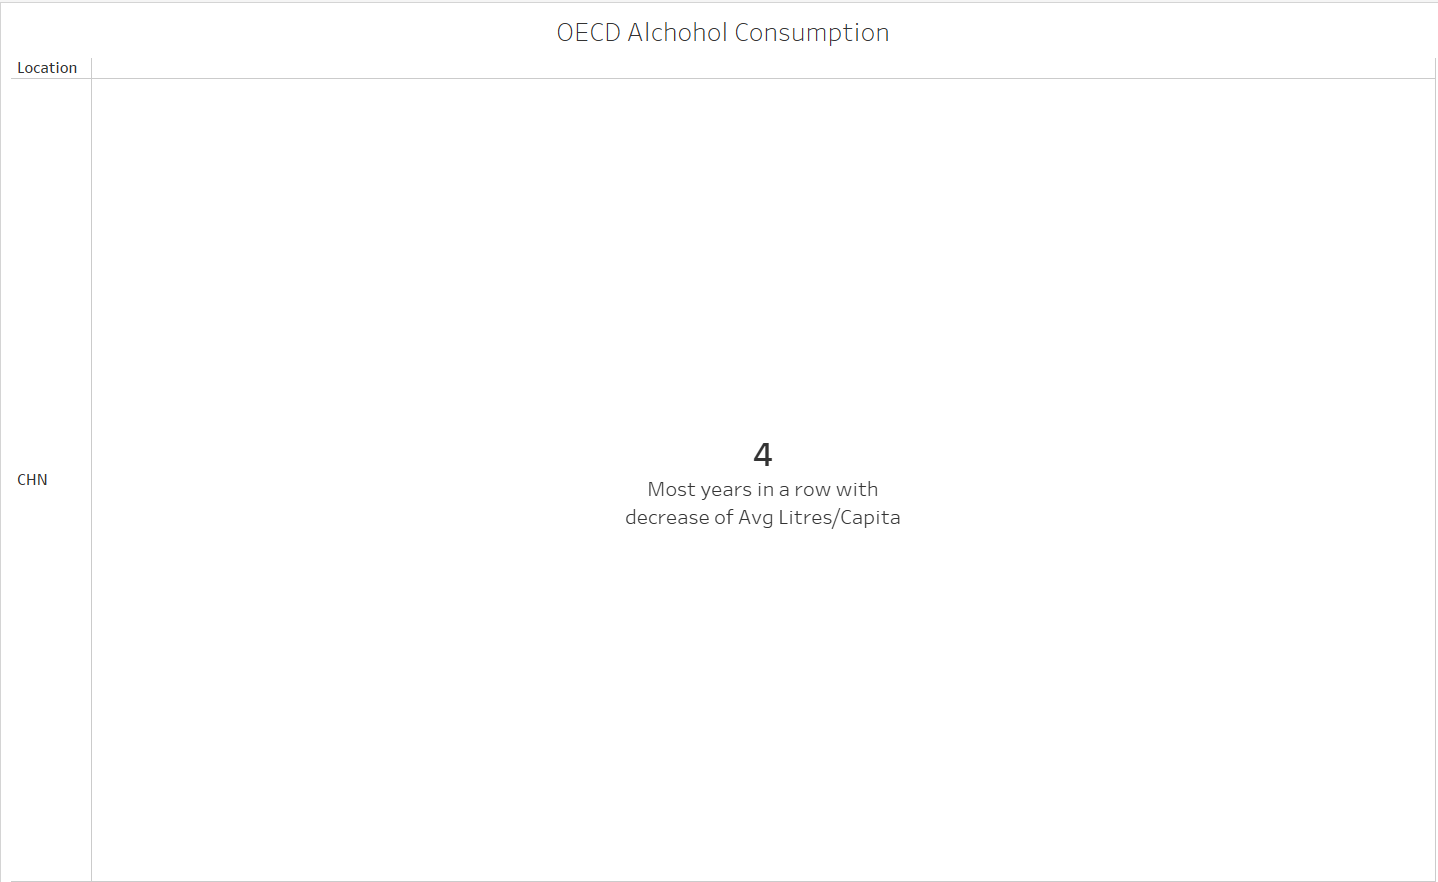
After having this calculation you can do things like this.

Then maybe include a parameter or other filtering action to let users switch the Country(location) they are looking at.
