This blog looks at what scaffolding is and when you will use it. I will be focusing on tableau prep as I will be showing a couple different ways of how to do scaffolding.
So what is scaffolding?
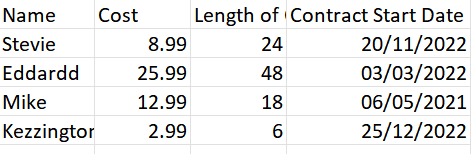
Scaffolding is creating shapes of data to see what the granularity is. You can do this with anything that is ordinal such as dates, ages, income, etc. Sometimes data analysis is needed for rows of data which have no data in. Scaffolding is therefore used to fill in the gaps so a more complete picture can be shown. This example below demonstrates what this would potentially look like: I made a data set that included four people with different costs and subscriptions to national geographic.
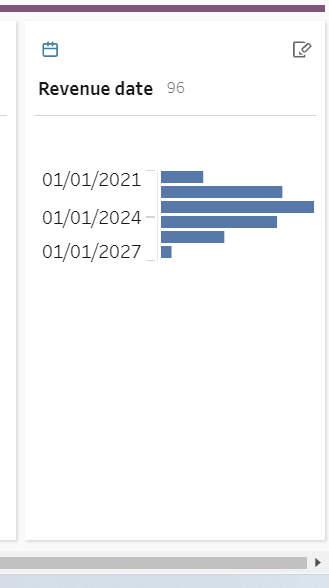
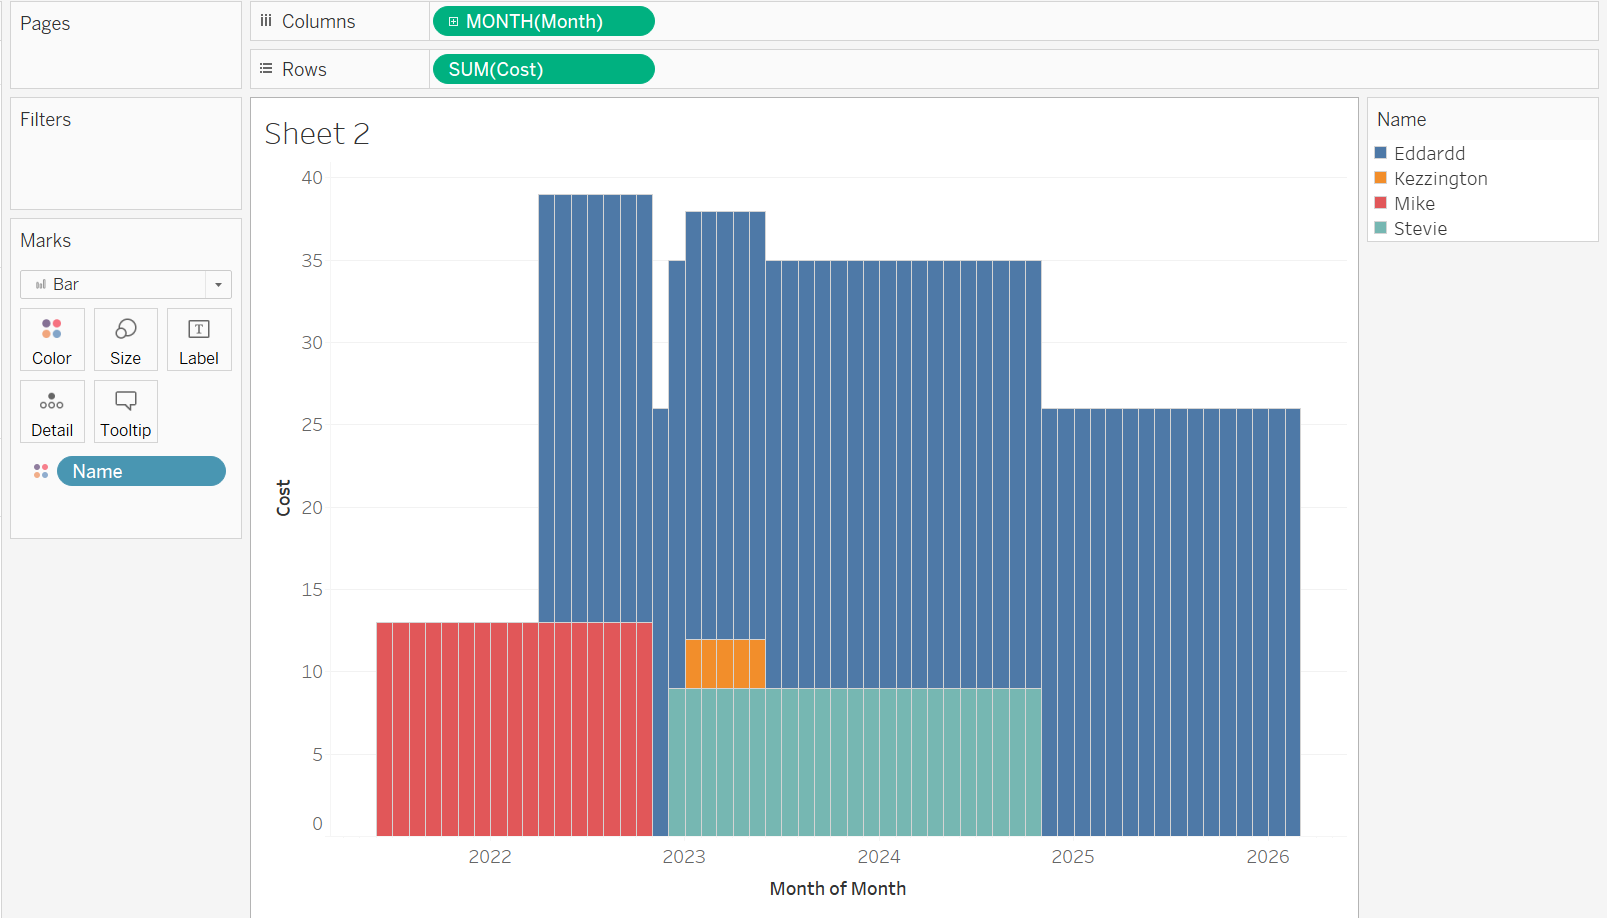
Below shows the revenue over time based on contracts but as we can see there is gaps missing.

Three types of scaffolding that can be done in prep:
The first type of scaffolding involves Excel which can be added straight to Tableau. The second type will be done straight away in prep and the third and final way once again can also be done in prep this is a new feature recently added.
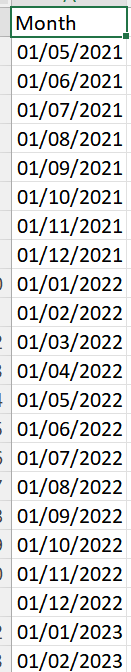
Starting with creating more months in Excel. I have calculated how many months is needed and have just dragged down to the date to that is needed.
Now you can join these two together through a relationship in tableau. But first we are going to need a calculation.
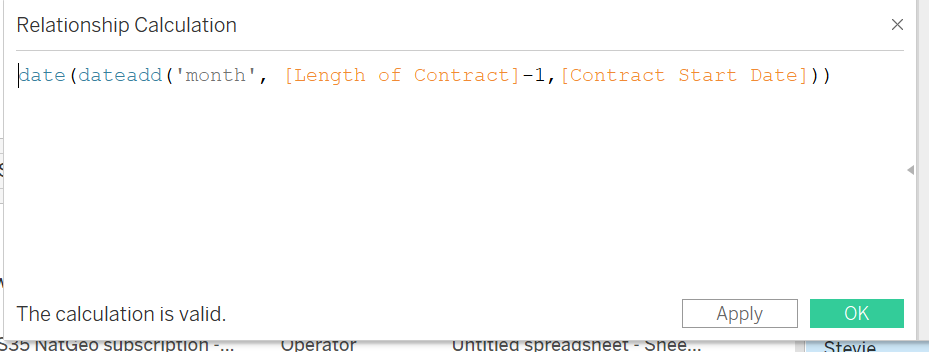
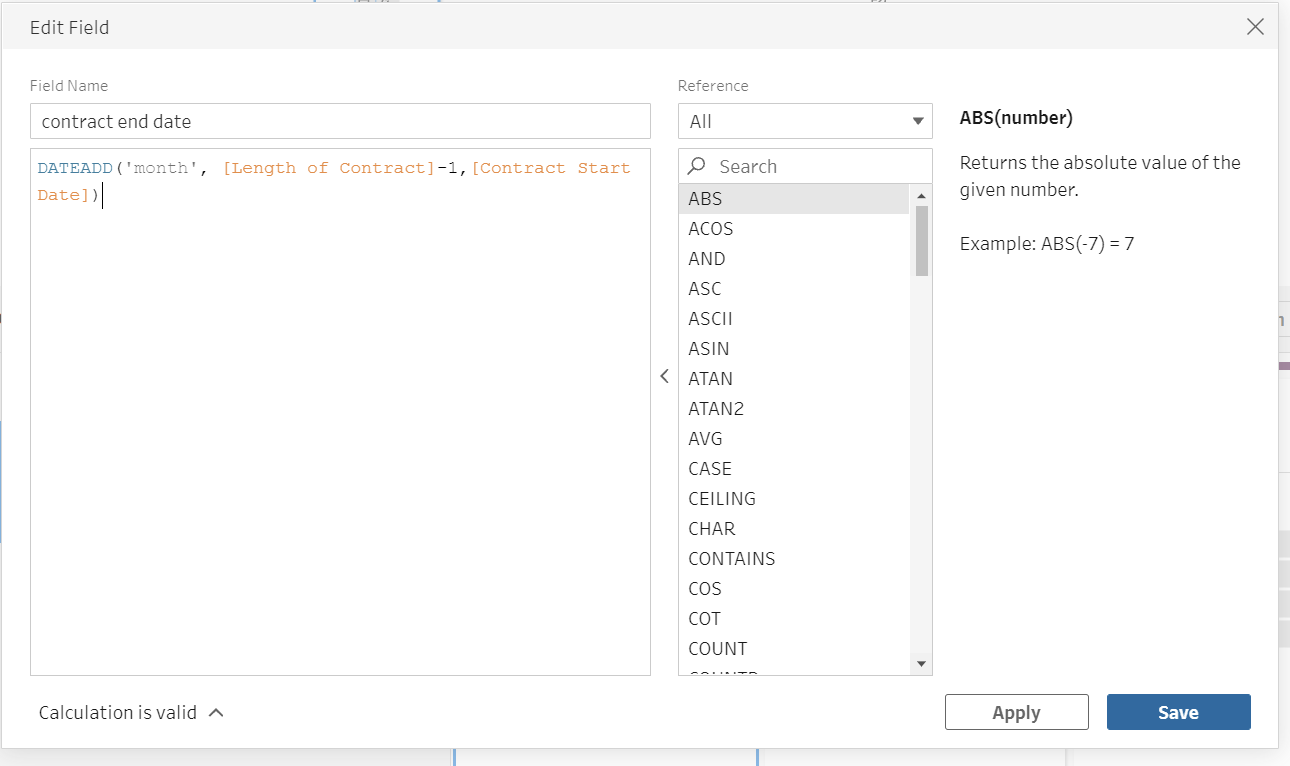
The calculation below is saying create a date based on the month and include the length of contract minus 1 and the start date. The reason we minus one is because say for example someone's contract started on the 1st November and was 2 months long Tableau will automatically male this 3. What this means is for a 2 month contract we would want just November and December because they would be paying for November as well as December. Whereas tableau would go November, December then January as it thinks its two months after the first date and not including it- hence the minus one.
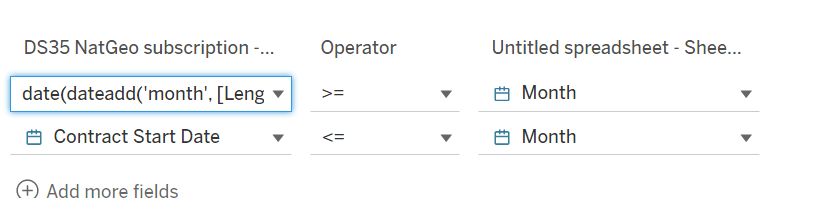
Now that our calculation is done we can create what the relationship is going to be based on. We have two conditions that are needed for this we want the contract length to be greater or equal to the months as this is basically saying make sure the length of contract is after the start date. The second condition is basically saying from the time it starts do not go over the contracted time based on the one created above.
Now we have a relationship we can now recreate our new graph in Tableau and we can see the gaps are filled in to show the length of each contract.
The problem with this method is that this is not dynamic so if new data is added there contracts may not display. This brings us nicely onto the second method which is in prep and creating a join.
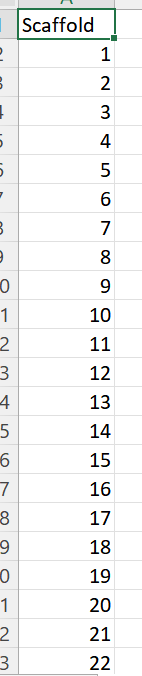
For this we will also be using excel. But this time we will be creating a max number of contract months and therefore no one can exceed this for a subscription. But this will allow any new contracts to be added and be evaluated. (My list goes up to 60 but for the picture below I can only show 22.)
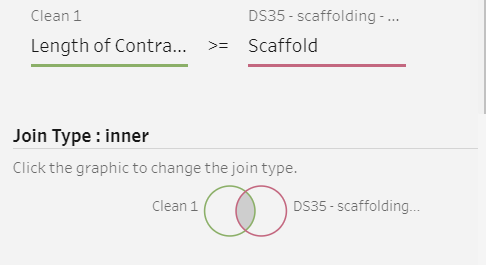
The join condition here is the length of contract is larger then or equal to the scaffold so that it can never exceed the max.
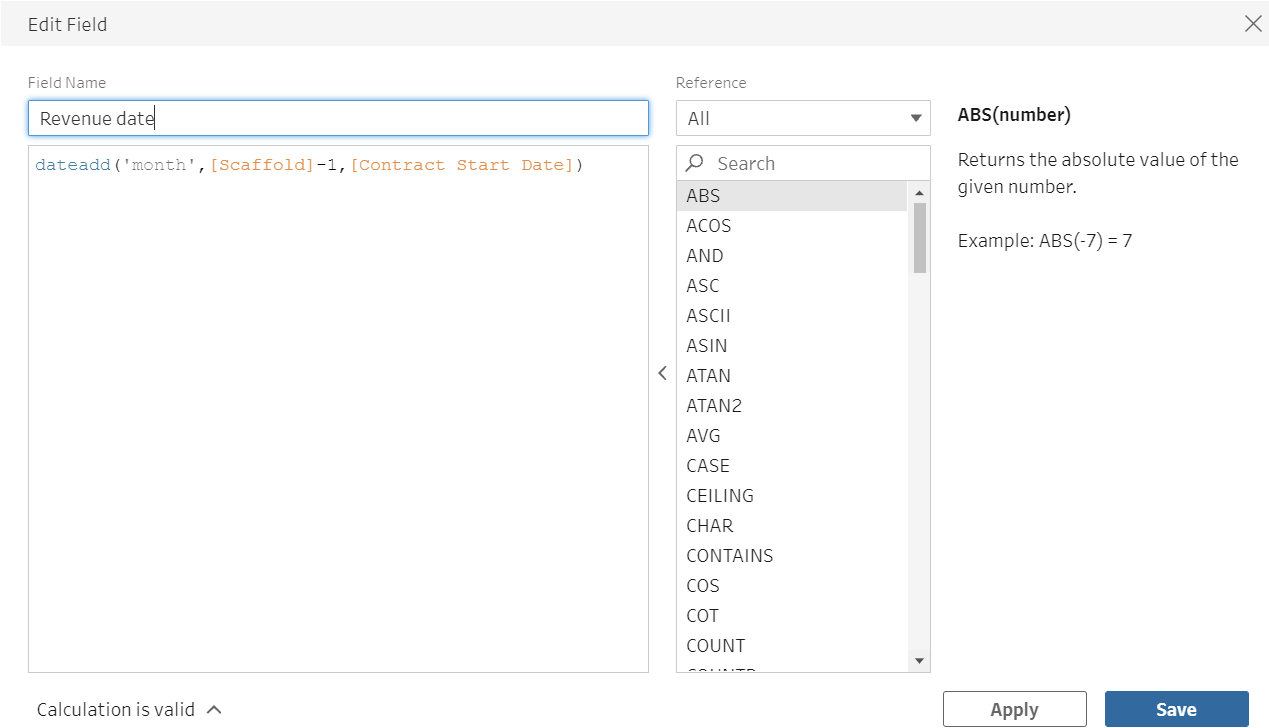
Now we can add the calculation we did in the first step so that the dates of each contract is added. I called this revenue date.
Finally Tableau prep has this new update which allows you to do scaffolding without having to create new data.
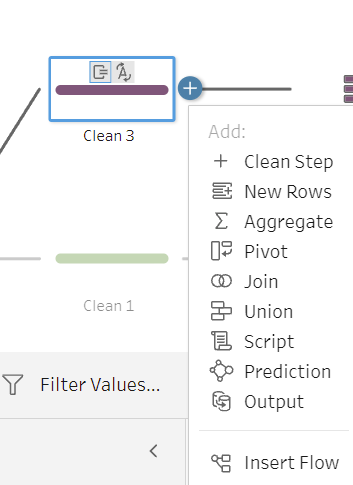
So first lets create a clean step. Now lets make the calculation. It is same as above but using the data that is already in this one table.
Now if we press the plus button next to the clean step we can select the New rows button.
This is the conditions we set
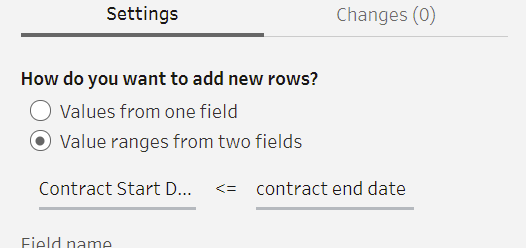
This will generate the following:
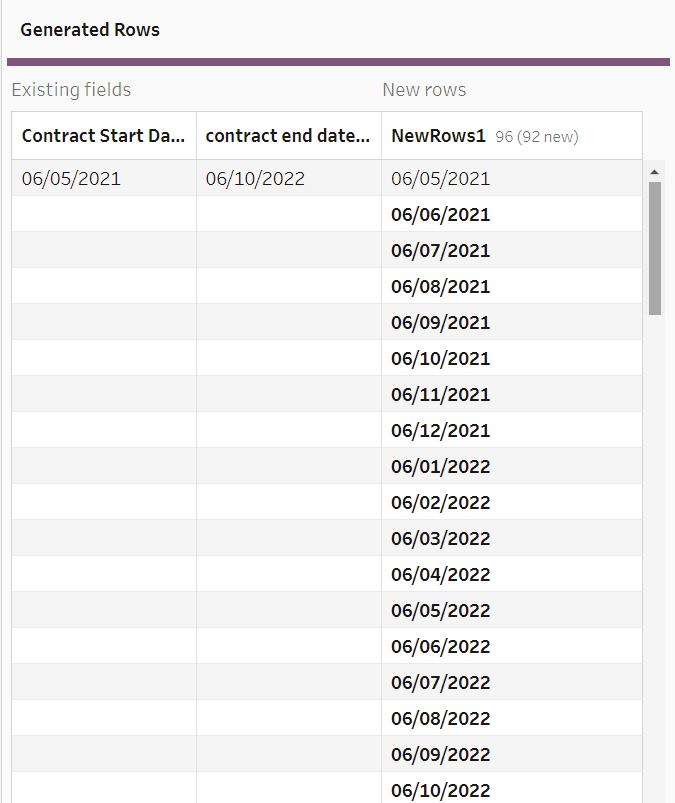
Then all I did change is change the name to revenue date.