


For day 4, we had to visualize survey data about American candy. The four years of data comes from The Science Quarterly Review.
Requirements:
- Download the data for all four years.
- Data prep must be done using Tableau Prep in the browser.
- They are more than welcome to supplement it with additional data.
- They must build their dashboard via web authoring.
This challenge I thought would be relatively easy because I believed that online would be very similar to desktop. (Though this is mostly correct there is different ways to format).
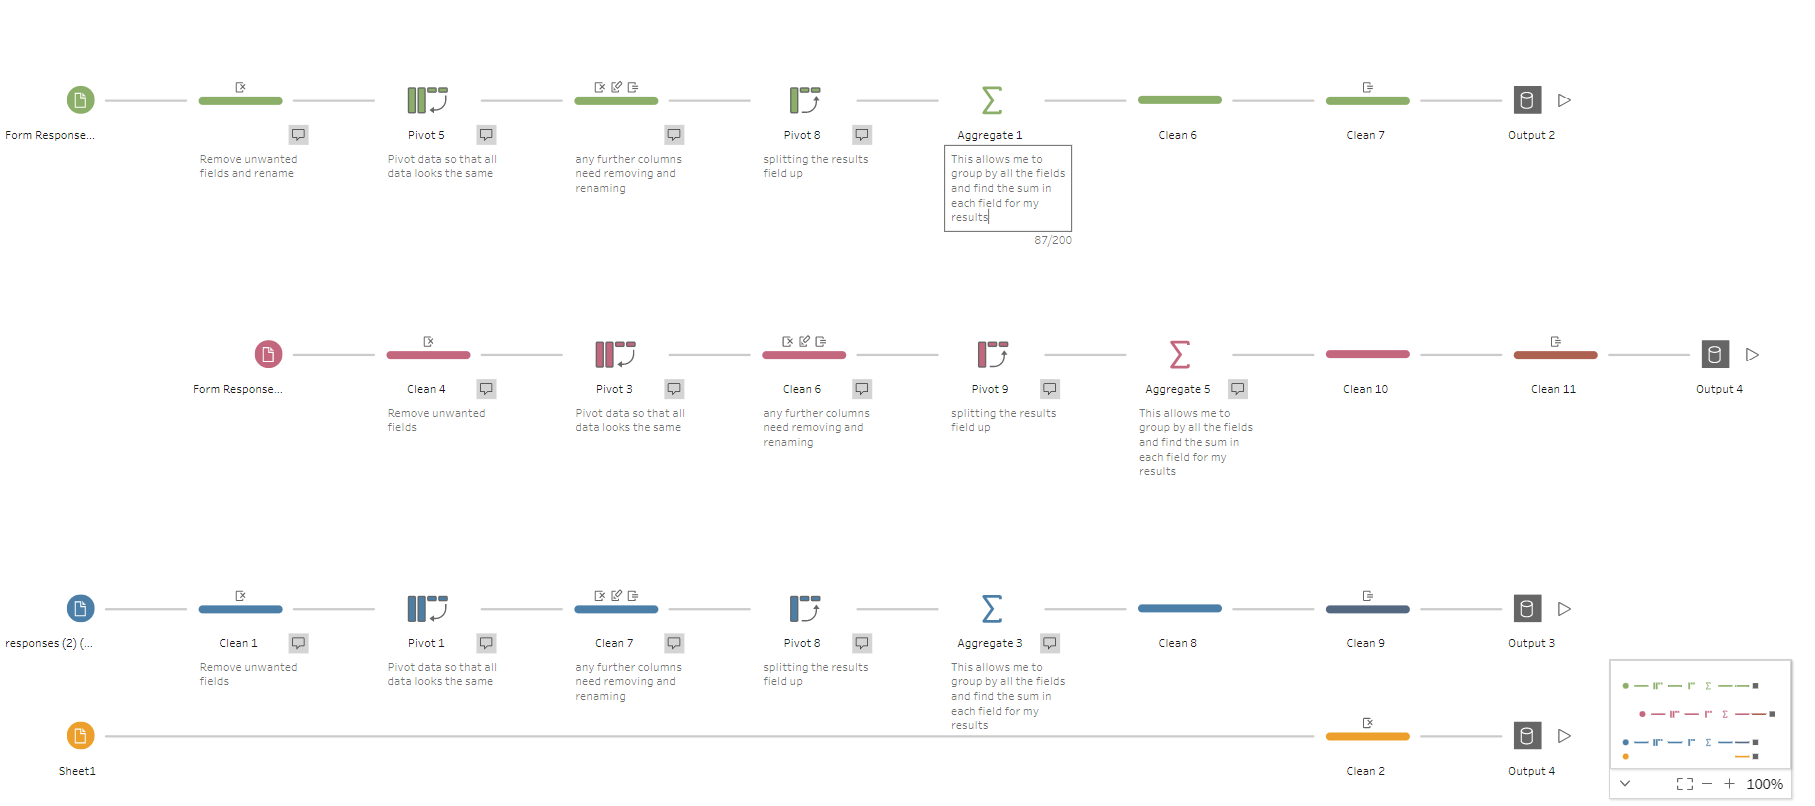
One of my biggest problems was the aggregation within prep which I had not realized till quite late. This for me was quite stressful as I was quite far in so needed to seek help as soon as possible. Once this problem got sorted I was able to continue making the dashboard.
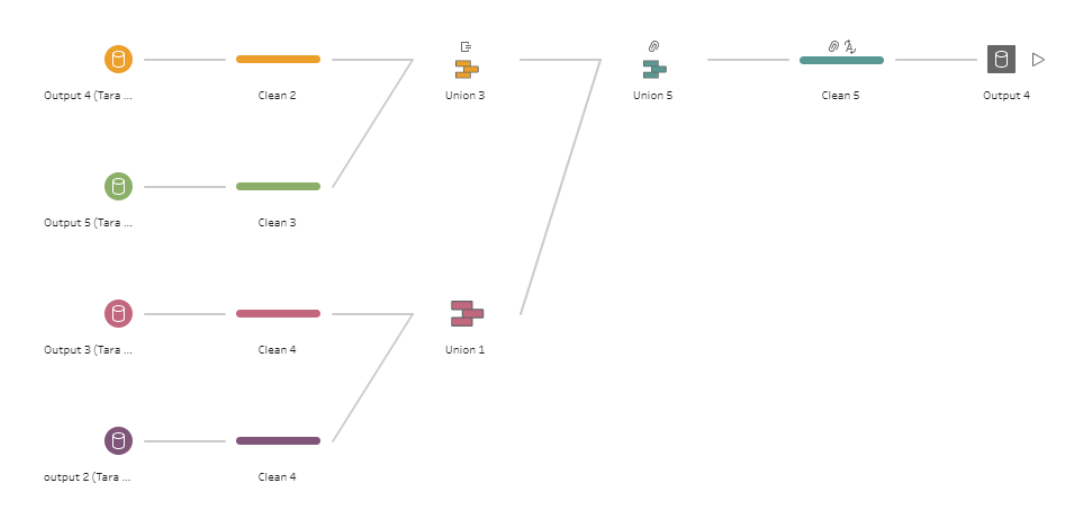
Final flows:
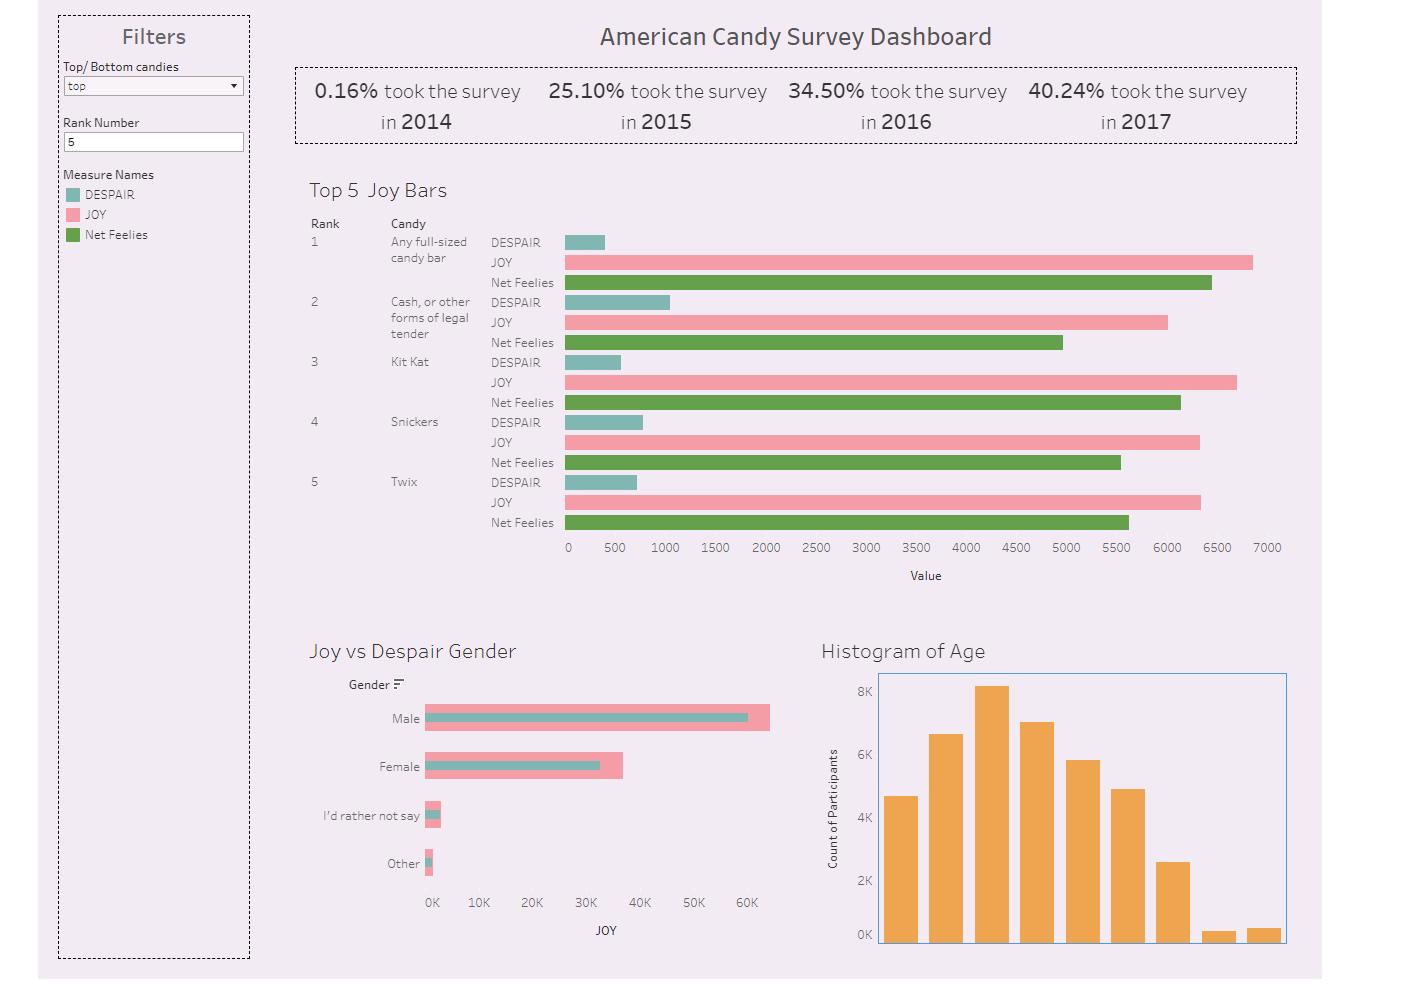
Final Dashboard:
What I liked:
- Mostly similar to desktop so was able to make things relatively quickly. This applies for both prep and Tableau.
- Data automatically updates when editing a flow in prep.
What I did not like about online:
- I could not format by right clicking you had to go into format tab and you had to format each worksheet separately and same for the dashboard.
- Once again you were not able to right click on a field and change the number formatting this was a lot harder then expected.
- In prep it did not like the unions in the one flow so had to make a separate flow.