Todays dashboard challenge comes from Coach Robbin. He’s a huge Rick and Morty fan and we needed more practice with APIs, so we are using the Rick and Morty API.
We had access to hundreds of characters, images, locations and episodes.
Before we can get onto the dashboard we had to start in Alteryx in converting the API from the Json format into something we can use. This is what my Alteryx workflow looked like:
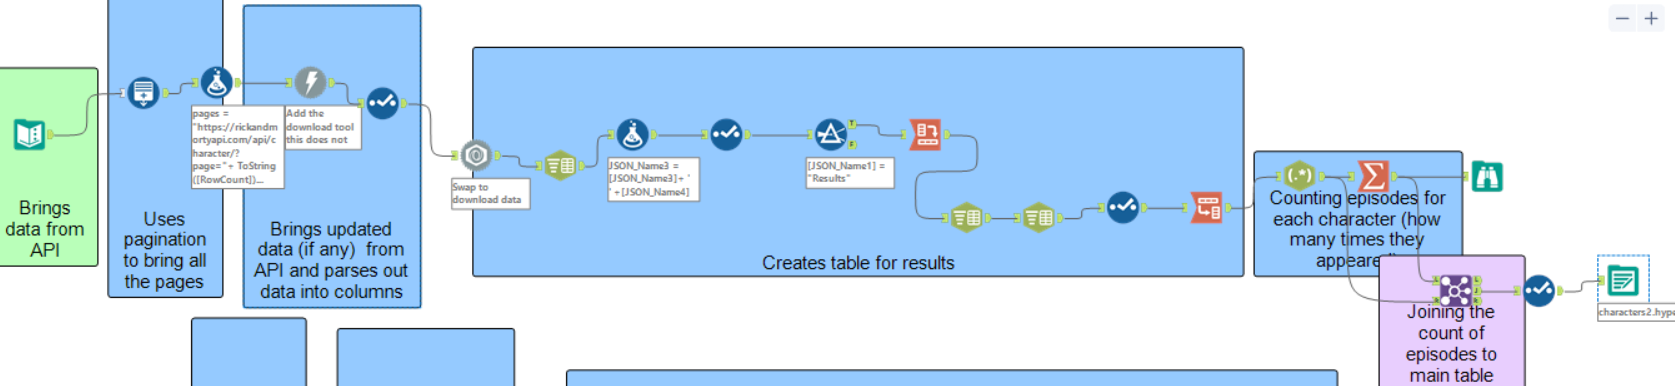
I broke it into three sections after adding the API to a text column first looks at the pagination. What this means is it allows us to get all the pages from the API rather then just one page. Next allows us to parse and download the data before creating the main table. Creating the main table was difficult because I have only worked with APIs once before this so I tried following the same format as I understood that to a degree but it was difficult working out which columns I needed and which ones I did not. The characters workflow had an additional step which was counting the number of appearances in each episode. This took up most of my morning and I was able to start dashboarding from just after Lunch.
So naturally first I explore what each column is. Then I looked for inspiration in tableau public.
This was part of one which I took inspiration from:
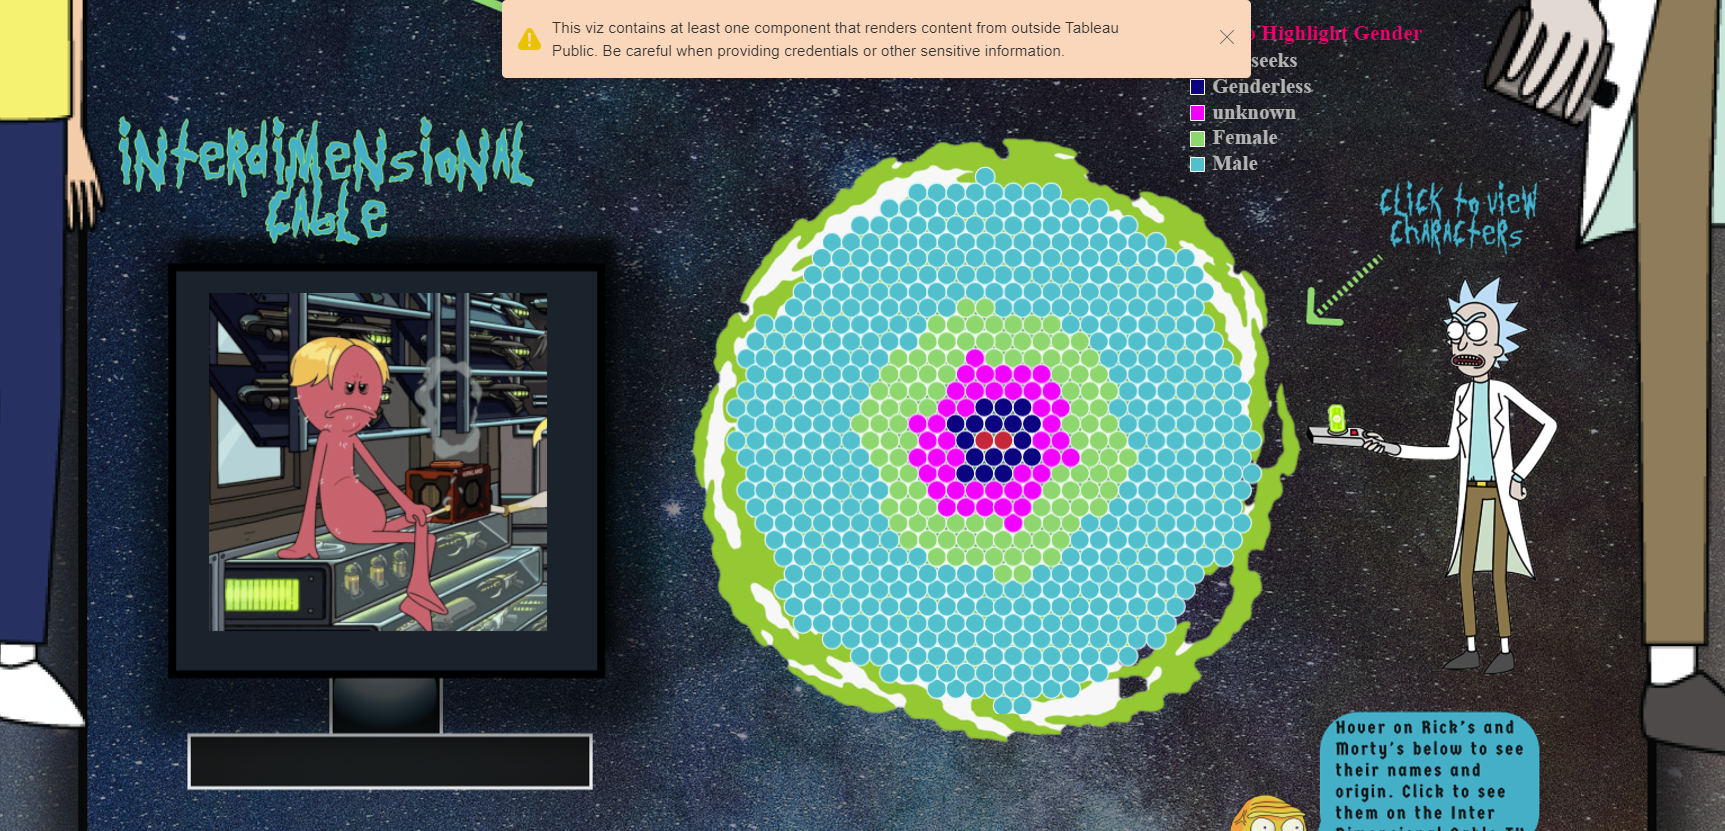
This was made by Siddhanth Shetty.
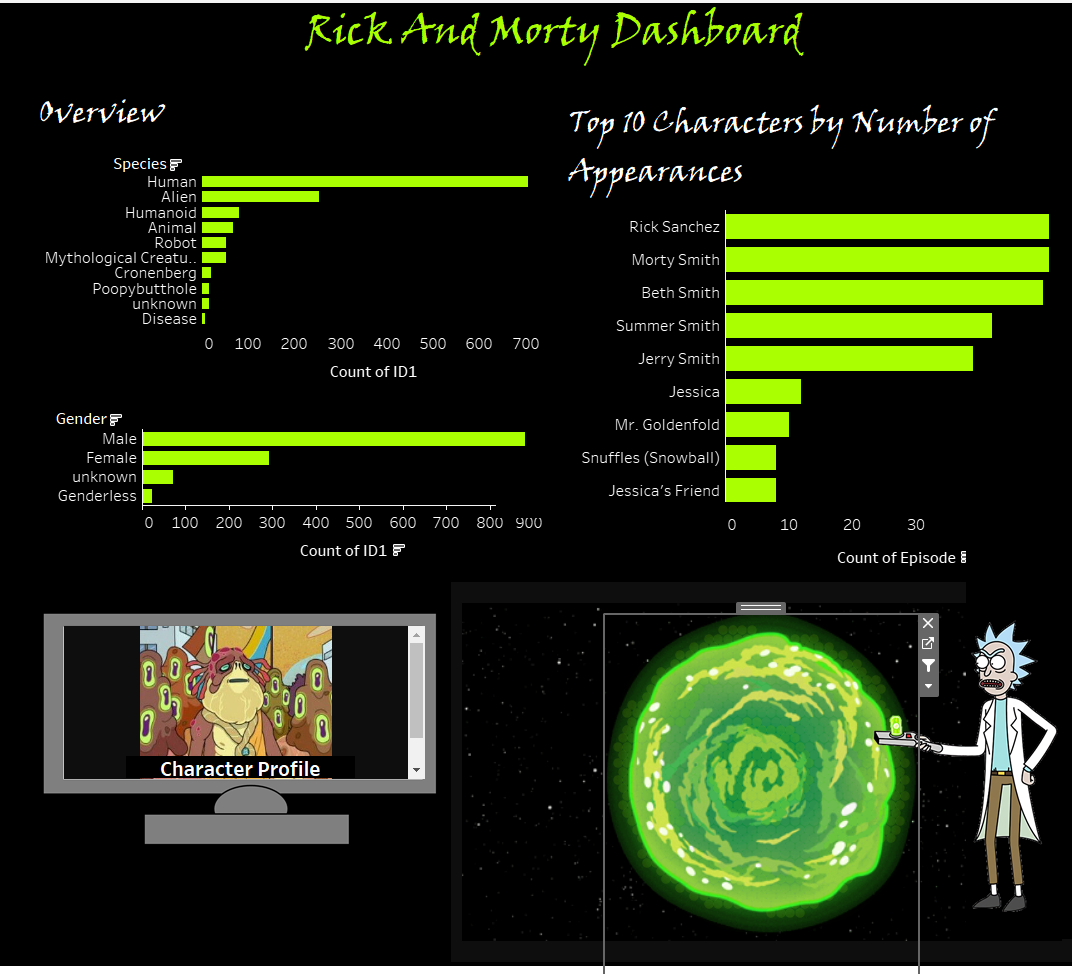
I really enjoyed this dashboard making as it meant we had to be so creative in what we could come up with because the data was so basic. This is what the final dashboard looked like :
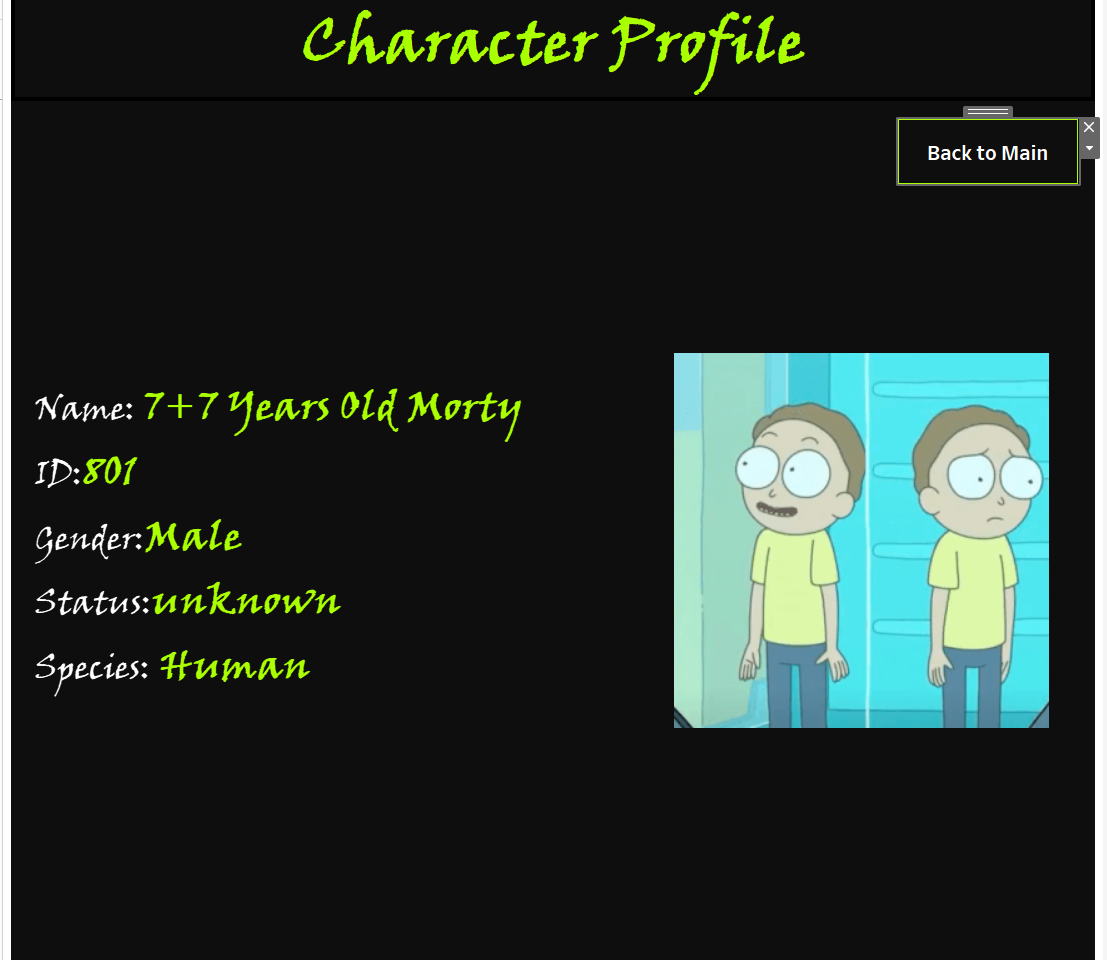
It was also able to navigate to a certain profile as well: