


This blog is going to look at what these three software's are and what I personally think the benefits and drawbacks are especially when trying to recreate the same dashboard in all three software's. As a point to be aware our training is mostly in Tableau so trying these two alternatives was very interesting and with longer training there would be times I may prefer these software's over Tableau. (This is however what I am use to so there is a slight bias). I had same amount of time to make all three
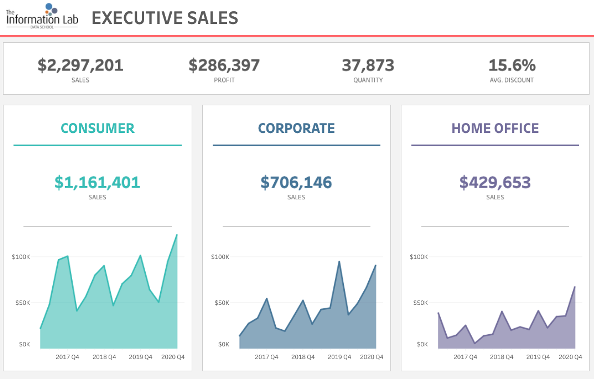
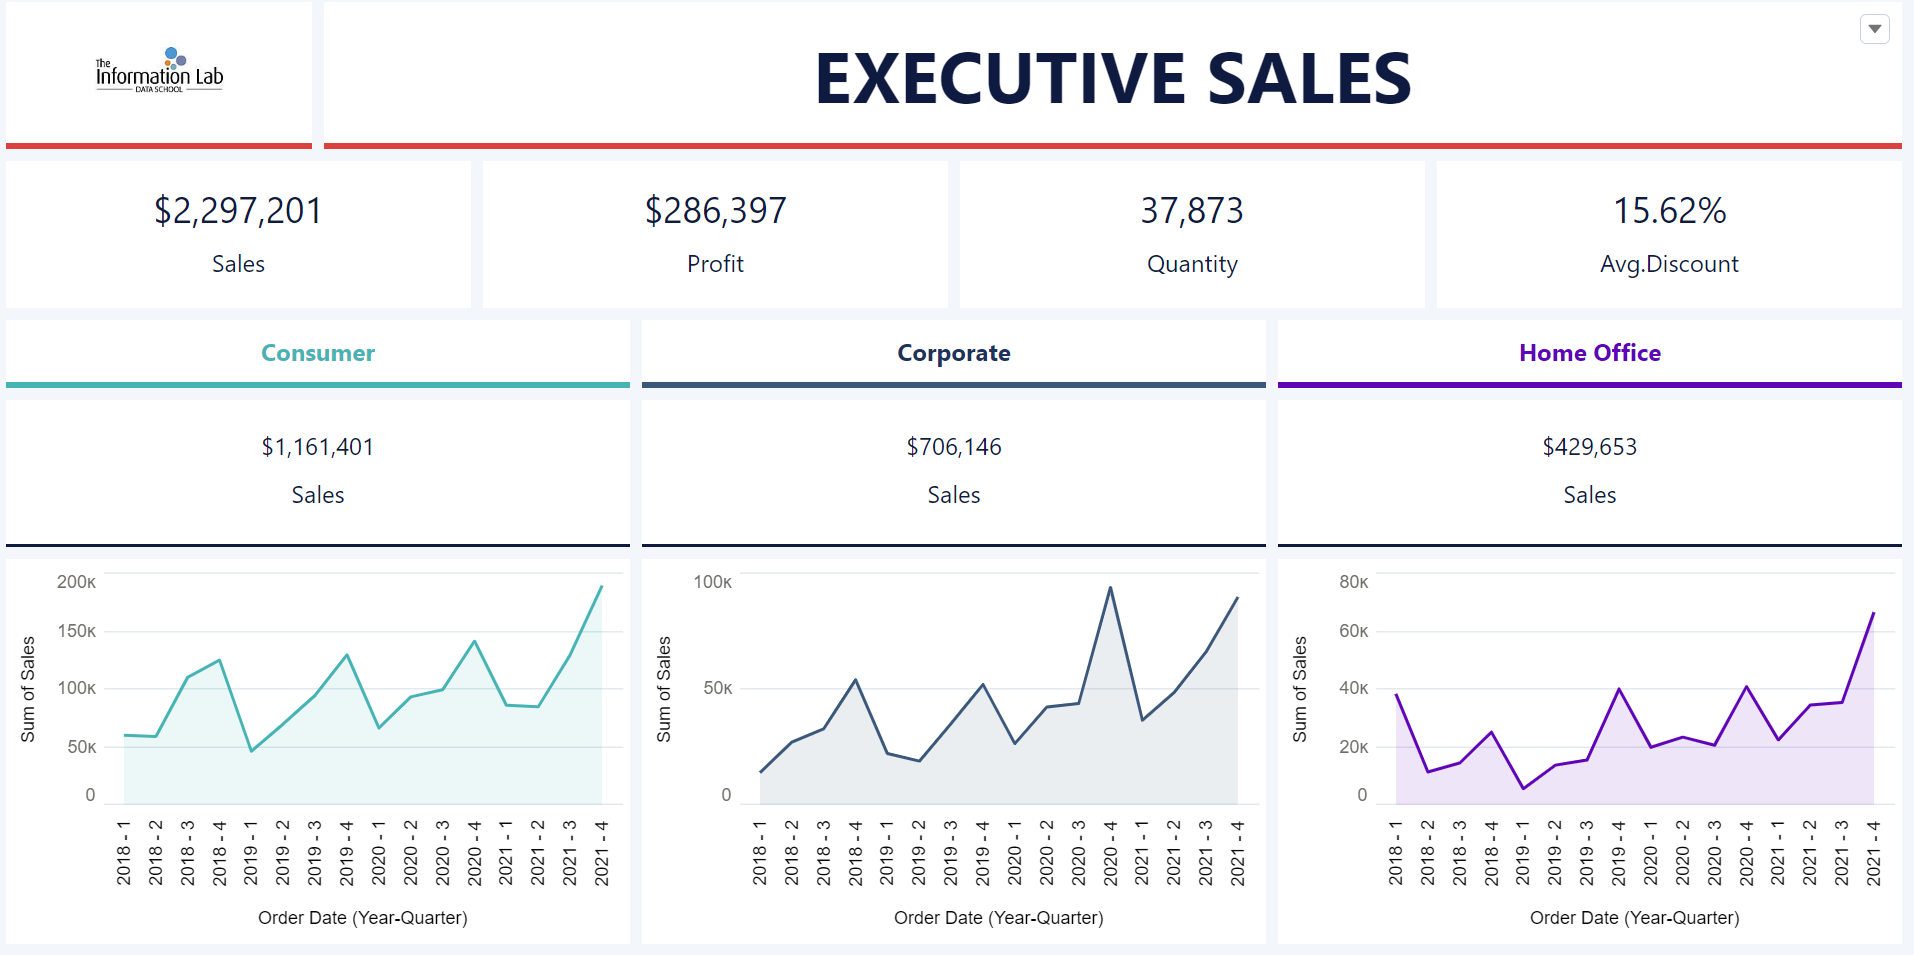
This is the dashboard we are creating ( this was made on Tableau):
I will start with Tableau as that is the one I've had the most experience with.
Tableau
Tableau is a visual analytics platform transforming the way we use data to solve problems
Benefits:
- Tableau allows you to be more creative and gives you greater control over the design of your visualizations.
- Tableau gives users more options to configure charts and you can edit every element of your work.
- Tableau is a very powerful tool and is capable of so much more than its two competitors (I may be wrong but as mentioned this is the one I have used the most).
Drawbacks:
- Tableau License's are very expensive compared to alternatives
- Tableau has a lot of useability and can take time to wrap your head round
CRM Analytics
CRM A is tool for analyzing customer relationship management (CRM) data and is tied into salesforce.
This was my dashboard below:
Benefits:
- I found CRM the most simplest to wrap my head round and this was probably my best attempt at matching the Tableau Dashboard.
- You can create multiple charts and BANs within a dashboard in a matter of minutes.
- The charts look quite nice as well.
Drawbacks:
- However where this one I found was easy it does have its drawbacks of being very basic and customization and control was quite limited.
- It can also be quite difficult to add the data in if you have never used CRM before
- It can also be an expensive option compared to Power Bi which can immediately put some companies off.
Power Bi
Power BI is a business intelligence tool that provides a range of data visualization and analysis features owned by Microsoft. For me this one was the most difficult to wrap my head round, but only due to the fact I was not familiar with Power BI.
Here was my attempt:

Benefits:
- Power BI is free if you use Microsoft products.
- Most people are familiar with Microsoft products Power Bi can be less intimidating as uses similar layout to excel.
- Really easy to add data and transform it, I especially found web scrapping easy to do within Power BI.
Drawbacks:
- The customization was also limited- for example for this one I could not find how to add the dollar sign and to change something to a percentage. But again this could be due to this software being unfamiliar.
- In Power Bi there is a data limit so if you are needing to work with very large datasets then it may not work.