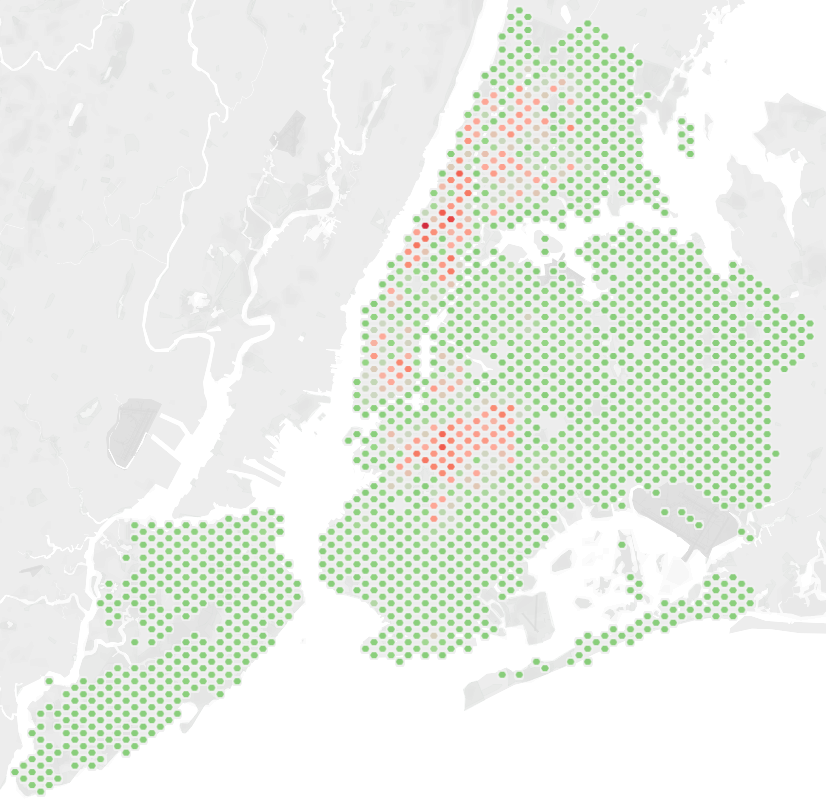
I like maps. They don‘t always add value to a visualization but when they do they are great for adding context. For example in this week’s Workout Wednesday they make perfect sense in order to create quick visual insights on where the most rat sightings have been in New York City.
A hexbin map additionally allows for splitting bigger areas, like a borough, into smaller bits and then add a custom shape. For the challenge I first downloaded the recommended hexagon shape and saved it to my repository as Tableau does not provide a hexagon shape.
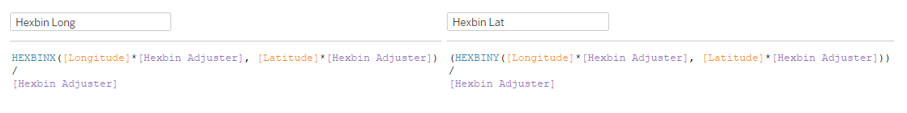
After that I created a parameter that let’s me adjust the size and this way also the count of my hexagons on the map. We then need to new calculations for our hexbin latitude and hexbin longitude using the hexbinx (for longitude) and the hexbiny (for latitude) functions:
We can drag those two calculations to columns and rows but need to make sure they are being used as geographic fields (right click + drag and drop and then choose the geographic option).
Change the viz type in the marks card to Shape and select your hexagon. Make sure to show your hexbin parameter so that you can adjust the density of the shapes.
Now you just need to add a field to the colour mark to create a hexbin heatmap: