Creating tables can be a pain in Tableau but even though one of the main purposes of Tableau is to leave tables behind you will now and then still find yourself creating them at least as part of your dashboard.
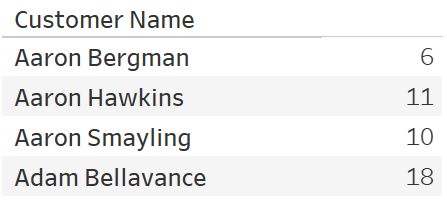
So let's say you have a table showing the number of orders per customer of the Sample Superstore. For that you have put Customer Name onto Rows and CNT([Order ID]) on the Text Card which will automatically generate this view:

But you would prefer to name the columns "Customer" and "Number of Orders" and Tableau is now giving you a hard time renaming them. Of course you could duplicate the customer field, rename it and then use the duplicate. You could also create a calculated field for the Count of the Orders named "Number of Orders" and put that as a discrete measure onto Rows as well. But there are easier ways.
Remember that when you double click a field in the view, the actual green or blue pill, it gives you the option to insert a calculation? Like adding the ZN() function to a field to change null values to zeroes? Well, you can add a comment line in there as well. And this comment line will then become your new header - it's magic.
So just double click on the blue customer name pill on the Rows shelf. Then add //Customer in front of [Customer Name] and bring [Customer Name] to a second line by pressing Shift+Enter. Your dimension pill basically consists of two lines now.

Unfortunately this does not work for calculations like the COUNT([Order ID]), so we have to do another trick here. In the data pane you can find the general "Measure Names" field. Put that onto Columns and it will generate a header that say "No Measure Value":

You can then edit the alias of this header by right-clicking and then you have a nice column name there as well.
