


Tableau has a lot of powerful functionality built in when it comes to visualizing geographical data, otherwise known as spatial data. There are a number of functions that aid the user in processing and visualizing spatial data, but this blog will look at the Makepoint and Makeline Function in particular. Put simply, these function will turn coordinates into a singular mark on a map, or a line 'as the crow flies' respectively.
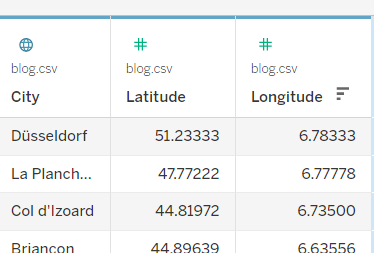
To use this function, we first require columns for longitute and lattitude, and ensure these are numeric values. If it is a string, convert it to a numeric data type, such as a float.
From this, we create a calculated field; name this field appropriately according to your data. The following points are each stage of the Tour de France, so I will name them Tour De France Stages.
When creating this calculated field, here is the syntax:
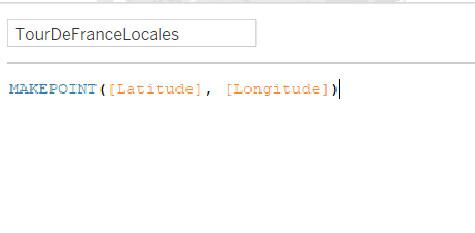
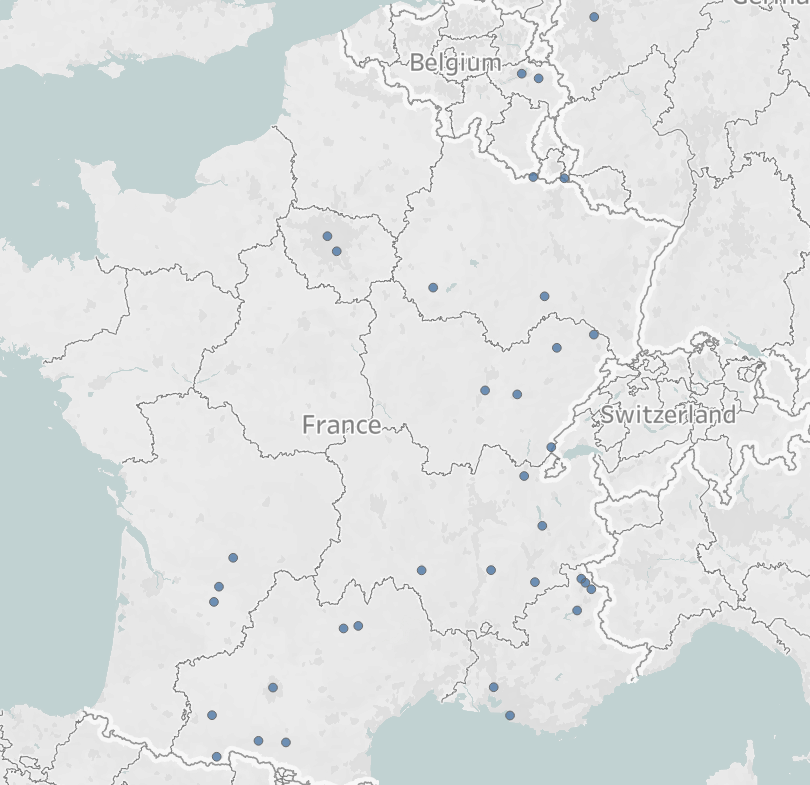
This will give you a spatial object. When you double click this dimension, it will populate the view with different points on the map according to the data fed into it.
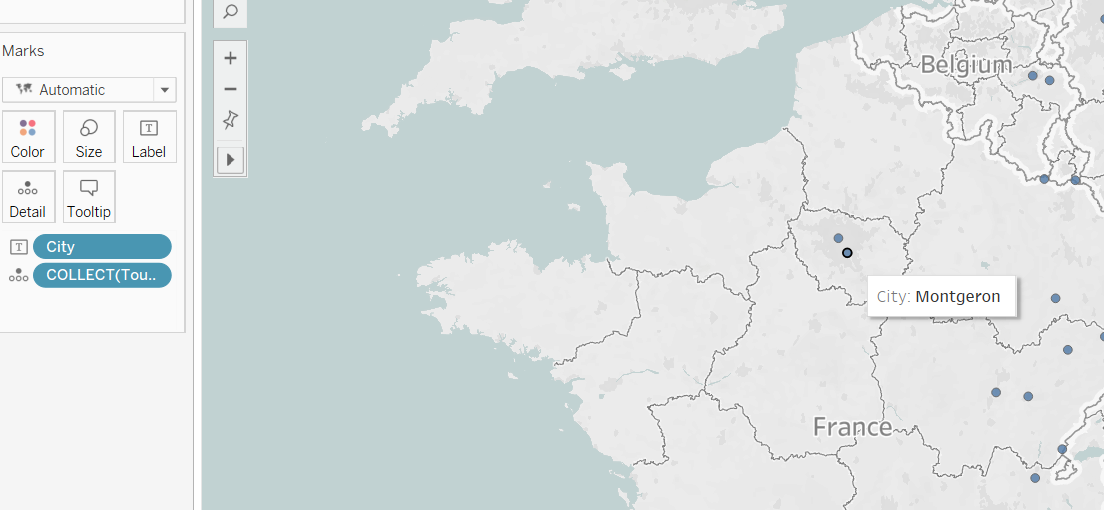
From this you can continue to add dimensions and measures to the mark data as you build your visualization. Here, City is added to Label in the marks pane, adding a city to each mark:
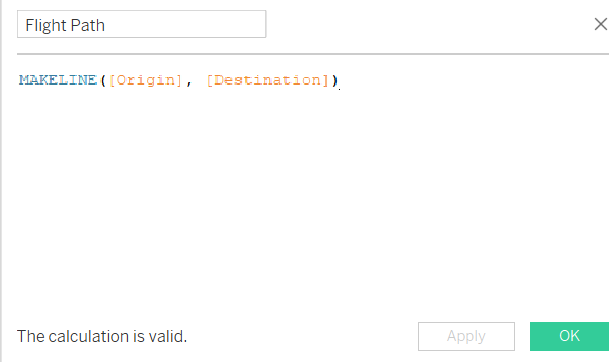
MakeLine is a very similar idea but returns us two marks that create a direct line between the two points. For this we need the longitude and latitude for an origin point, and a longitude and latitude for an end point. The dataset used in this example looks at flight path data with longitute and latitude given for the origin airport, and destination airport. From this we can create points via the makepoint function for both spatial points as exemplified in the tour de france example. And we refer to these two spatial objects we have created in our calculated field and use Makeline with the syntax for this is as follows:
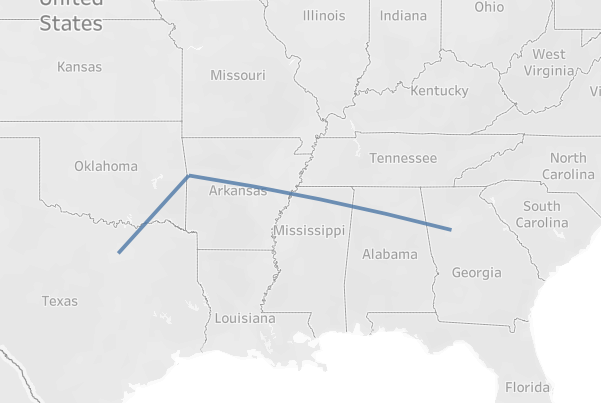
The lines will appear on our vizualisation as follows. Initially it will be one whole spatial object. As in, the two routes will be treated as one object by Tableau.
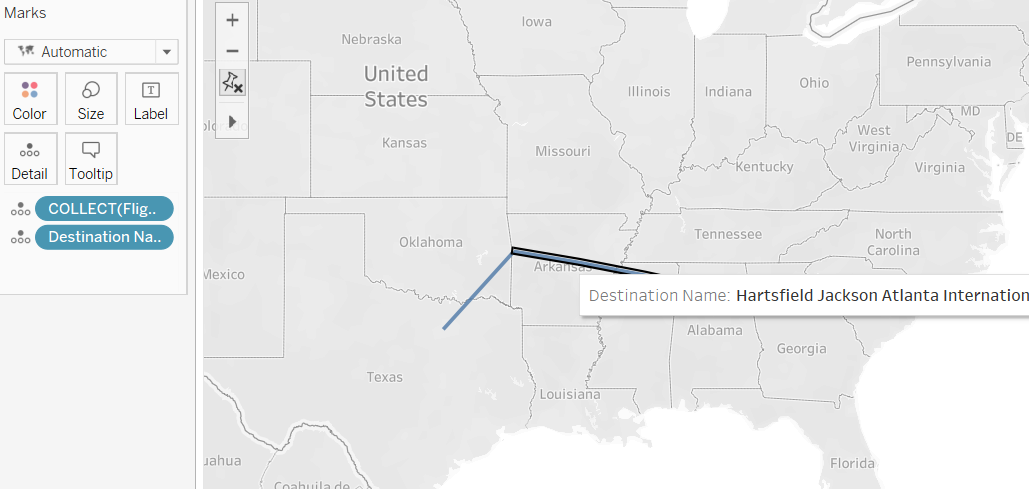
To break this up, we can add destination name to the marks pane on Detail, giving use two seperate routes on our viz:
Working with Spatial Data is very easy with Tableau and opens the door to a whole host of fun and insightful visualisations. There is plenty accessible spatial data on a wide variety of topics just a quick google search away.