Net Promoter Score (NPS) is a widely used metric for measuring customer satisfaction and loyalty.
Respondents answer on a scale of 0 to 10, where:
- Promoters (9-10) are enthusiastic customers who are likely to refer others,
- Passives (7-8) are satisfied but passive customers,
- Detractors (0-6) are dissatisfied customers who could potentially damage your reputation.
The NPS calculation formula is as follows:
NPS=%Promoters−%Detractors
The result ranges from -100 (if all respondents are Detractors) to +100 (if all are Promoters).
Depending on the structure of your data, there are a few ways to approach this calculation in Tableau. The first step is to count Promoters and Detractors. If the response data is numeric and has a scale of 1 to 10, then the calculation could look like this:
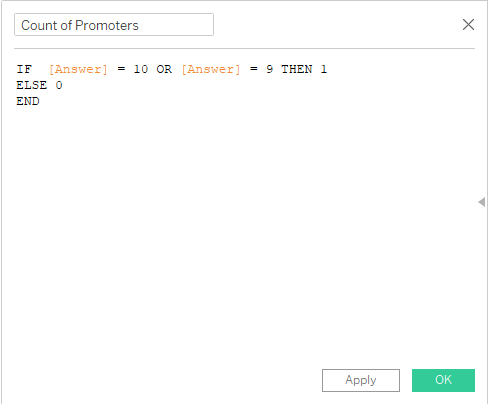
Likewise, Detractors will be grouped together in separate calculations and counted.
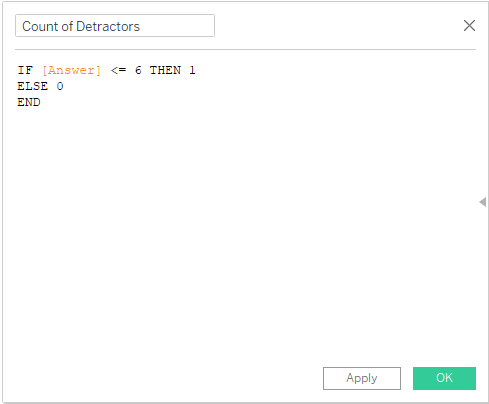
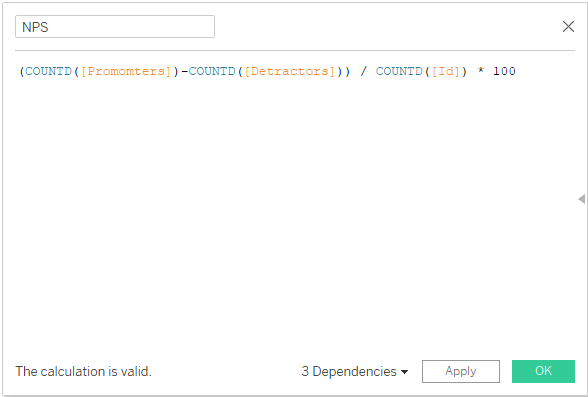
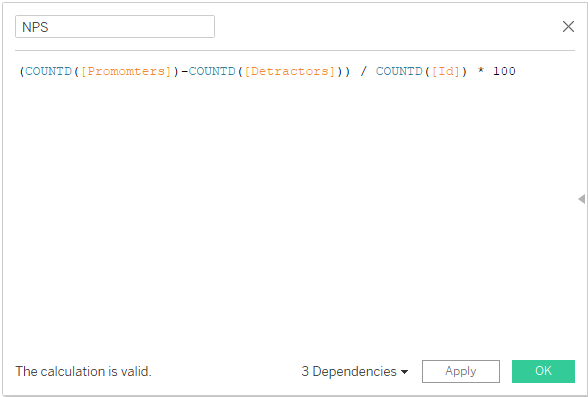
After determining the count of Promoters and Detractors, the values can be used in the NPS formula. Dividing by the total number of respondents (IDs) normalizes the result, providing the proportion of the overall audience. Multiplying by 100 converts it into percentage to represent the NPS score:
In case the evaluation metric is a Likert scale, the procedure is very similar and only needs a different way of categorization. Assuming the response scale ranges from “strongly disagree” to “strongly agree”, it is possible to count the answers as Negative or Positive if they contain “Disagree” or “Agree”, respectively.
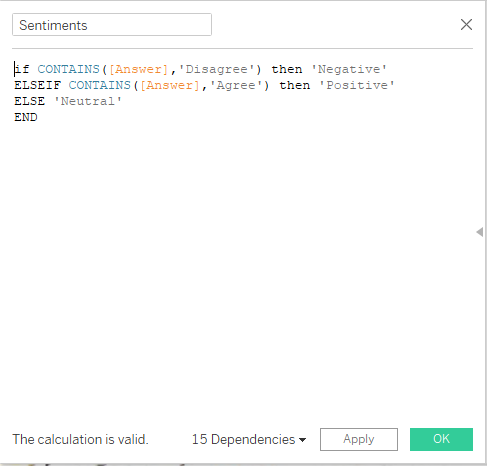
Once the answers are categorized, it is time to count Promoters and Detractors. Promoters should all have “Positive” answers and Detractors should be counted by the "Negative" answers.
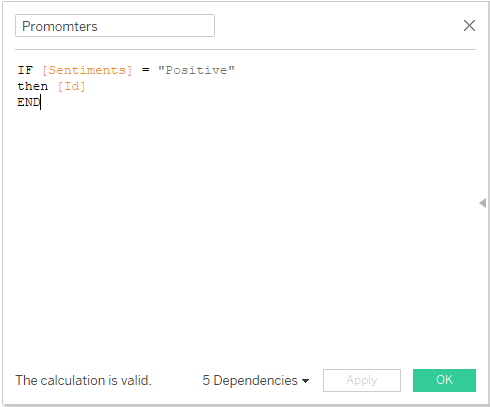
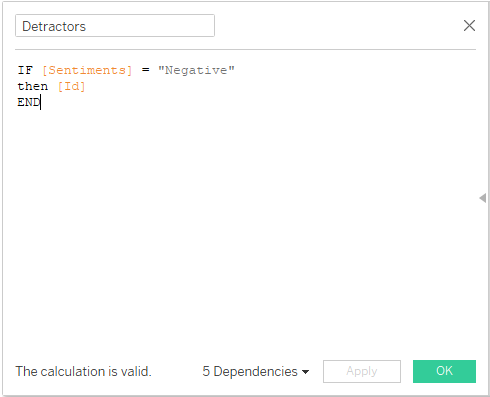
Once the measures are readily available, we subtract the distinct count of Detractors from the distinct count of Promoters and divide it by the total distinct count of respondents.
You can visualize NPS score to your liking. This example uses mock survey data.
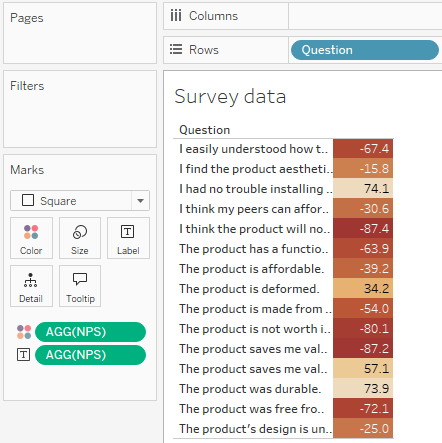
While NPS is a valuable metric, it doesn’t provide detailed insights into the nuances of customer experience and why customers give a certain rating. Its strength lies in providing a high-level indicator of overall customer sentiment.
