


A few weeks ago, for a client project, I was interested in allowing the client to adjust the standard deviation of a chart. Before this project, I would create the standard deviation through the analytics pane. This can be done by selecting the distribution band, and then selecting the standard deviation on the value dropdown. This is a great way to create a standard deviation if you need/ want the value to remain static. If you want to make the band dynamic follow the steps below.
1. Create a Parameter
The first step is to create a parameter. This parameter will be used later to be a control in the calculations for the standard deviation.
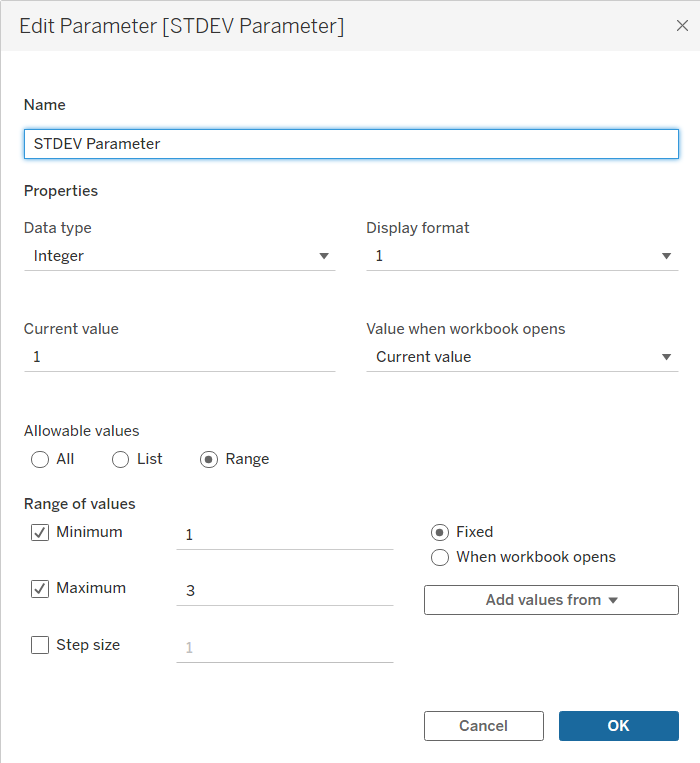
For this parameter, I set it as a range with the minimum being 1 and the maximum being 3. You can adjust the minimum and maximum based on your project needs. Click okay and now we'll begin creating the calculation.
2. Standard Deviation Calculations
For this step, you will need to create two standard deviation calculations, one for the lower bound and another for the upper bound. This calculation utilized the Window_Avg and Window_Stdev functions.
This is what the calculation will look like for the lower bound.
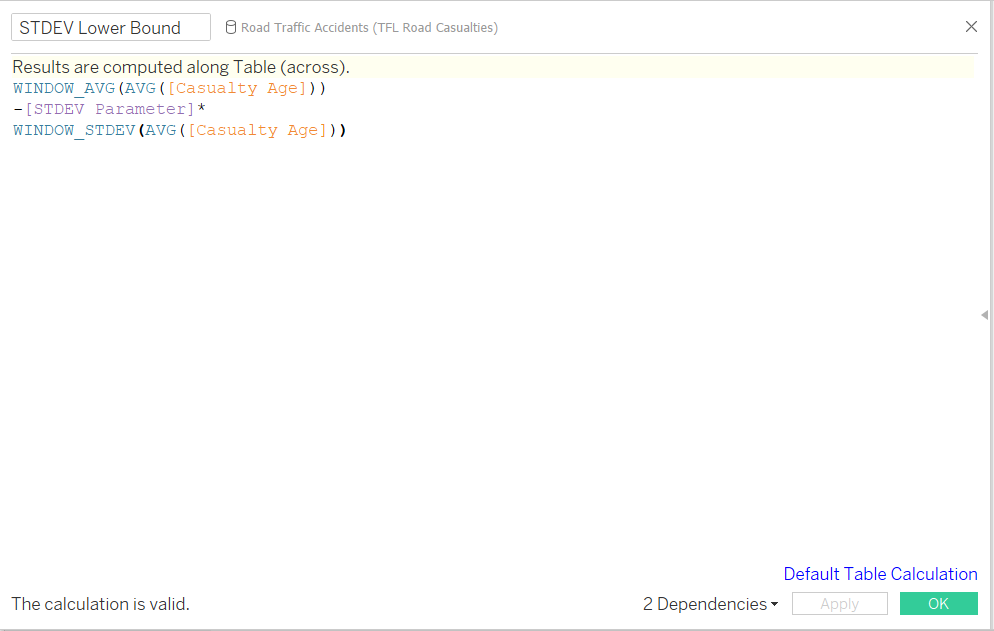
Now, we will duplicate this calculation and adjust for the upper bound. This can be done by changing the - sign to a + sign.

3. Create Band
Now that the parameter and calculations have been created we can step into the analytics pane to create our dynamic standard deviation band. In the analytics pane select 'Reference Band' under Custom. All that is left to do is set our band values.
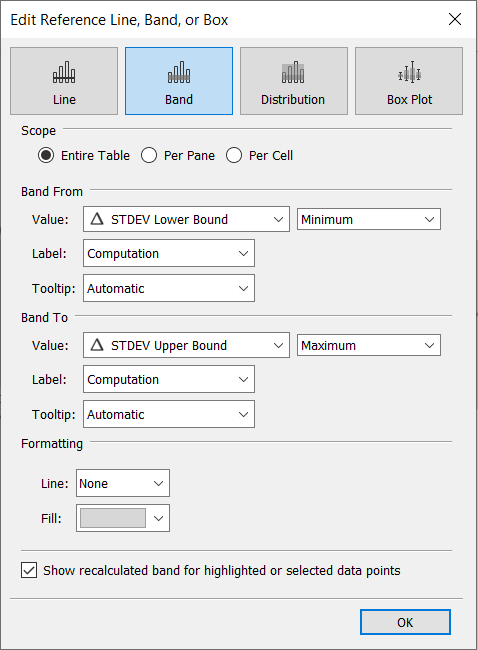
Click okay and you have built a dynamic standard deviation band! Your chart should look something like the image below.