The lookup function is one of many table calculations in tableau. Table calculation functions allow you to perform computations on values in a table. Allowing you to calculate what's on your current chart and not at the row level in you data source.
The Lookup function has a way it needs things ordered, Lookup(expression, offset). The expression is the aggregation you want use. so for example which measure are you looking to use and in our example that would be profit. this means it compares to a like value i.e. sum of profit from one compared to sum(sales) of another year. The offset is the number of time your comparing the expression. So in our example that is 1 ( from one year to another).
Step 1: Have your chart ready
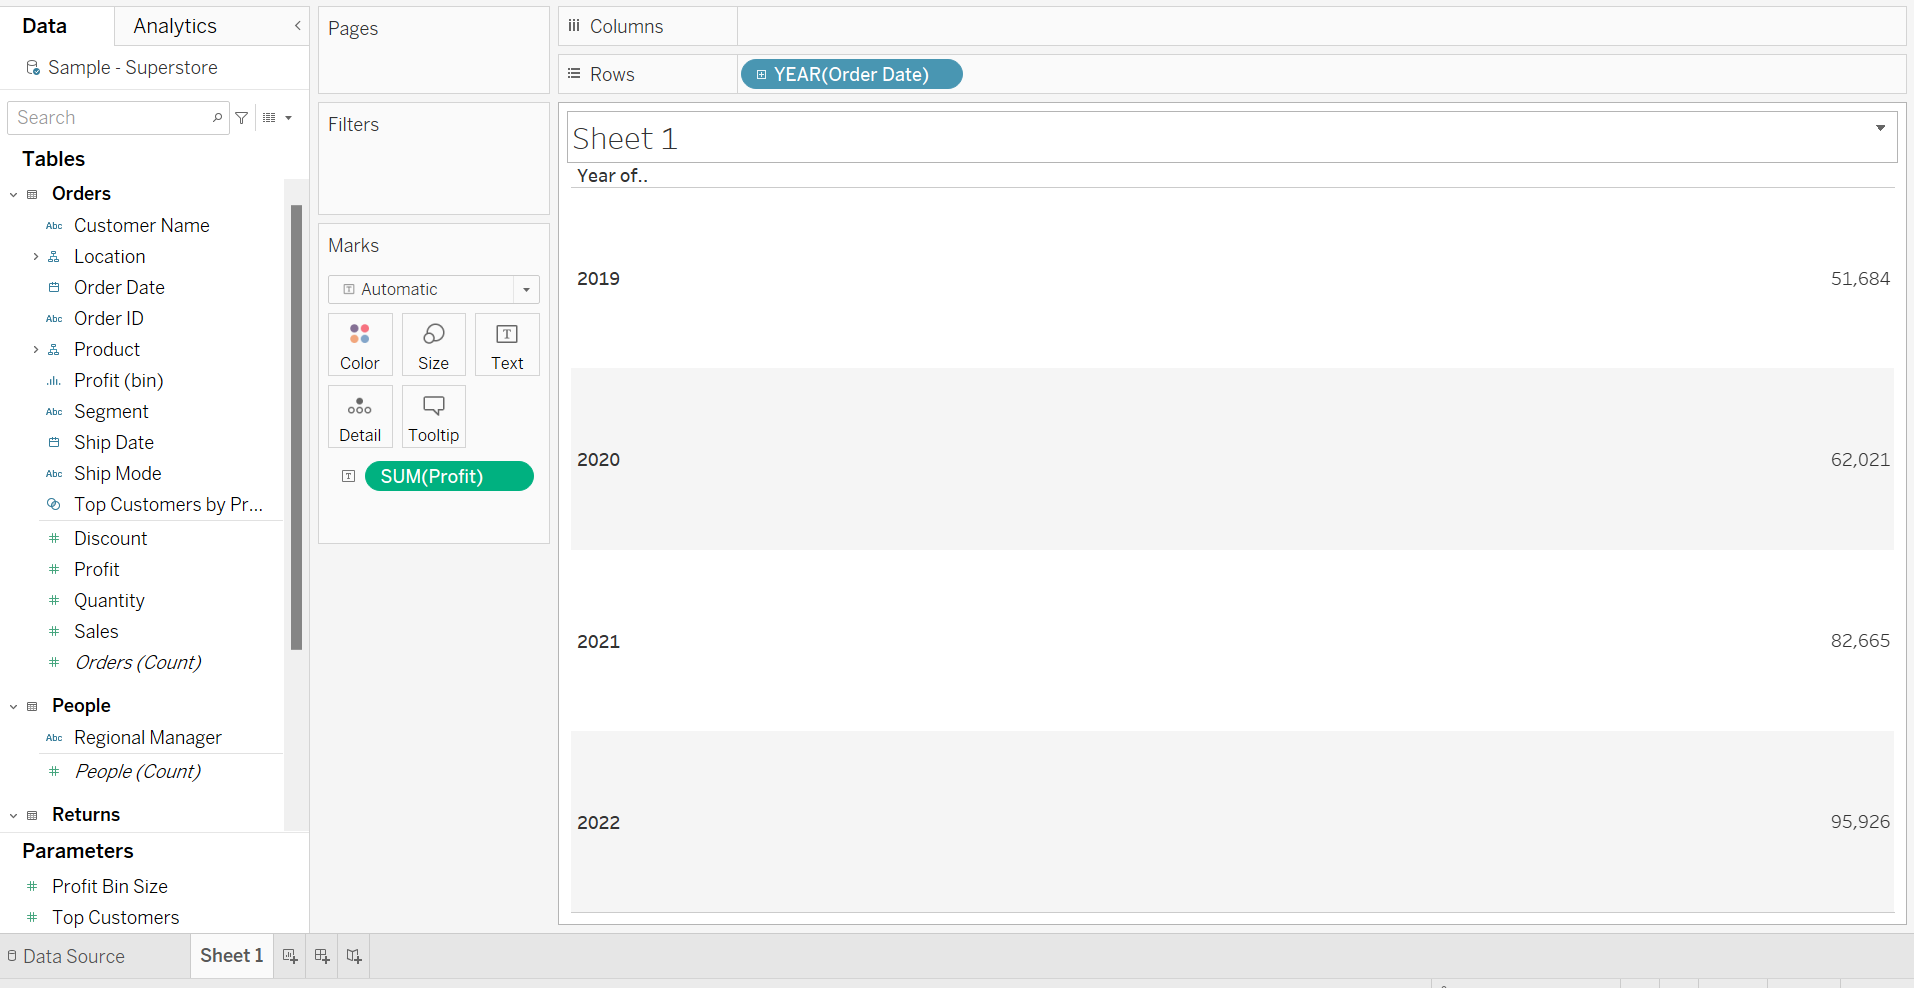
Step 2: Create your calculation

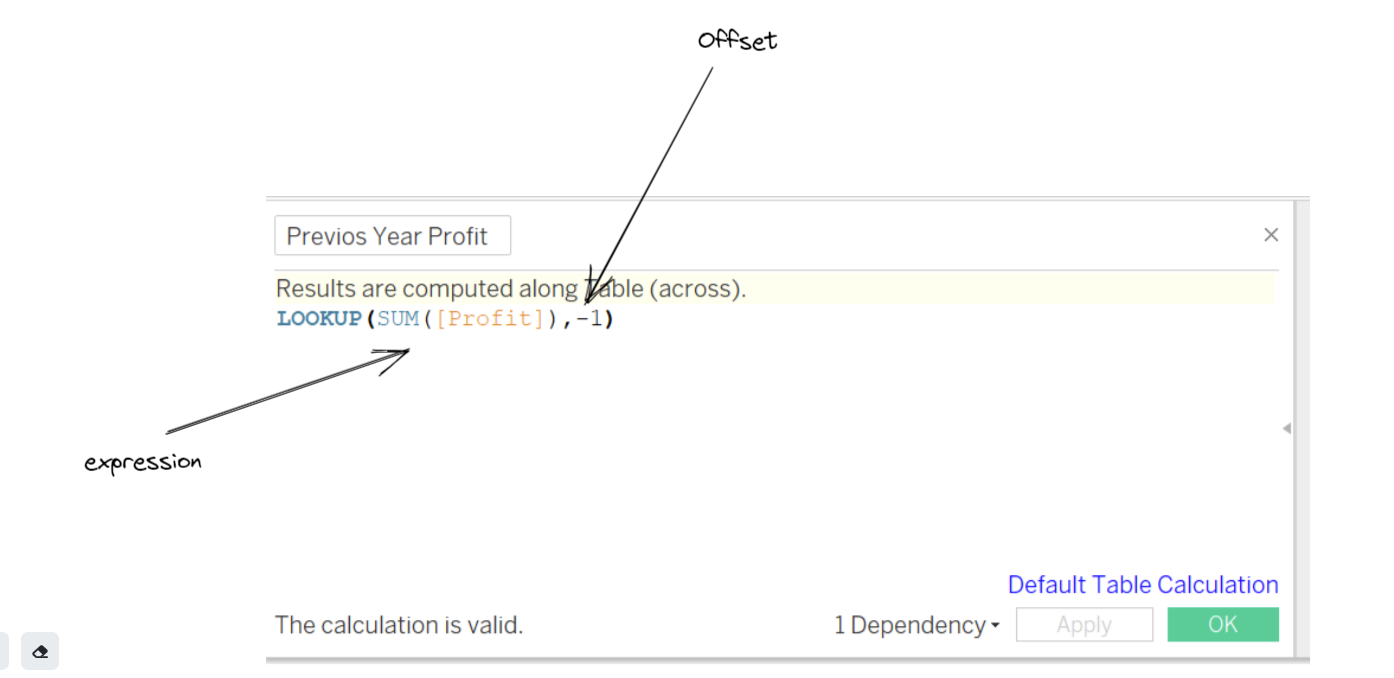
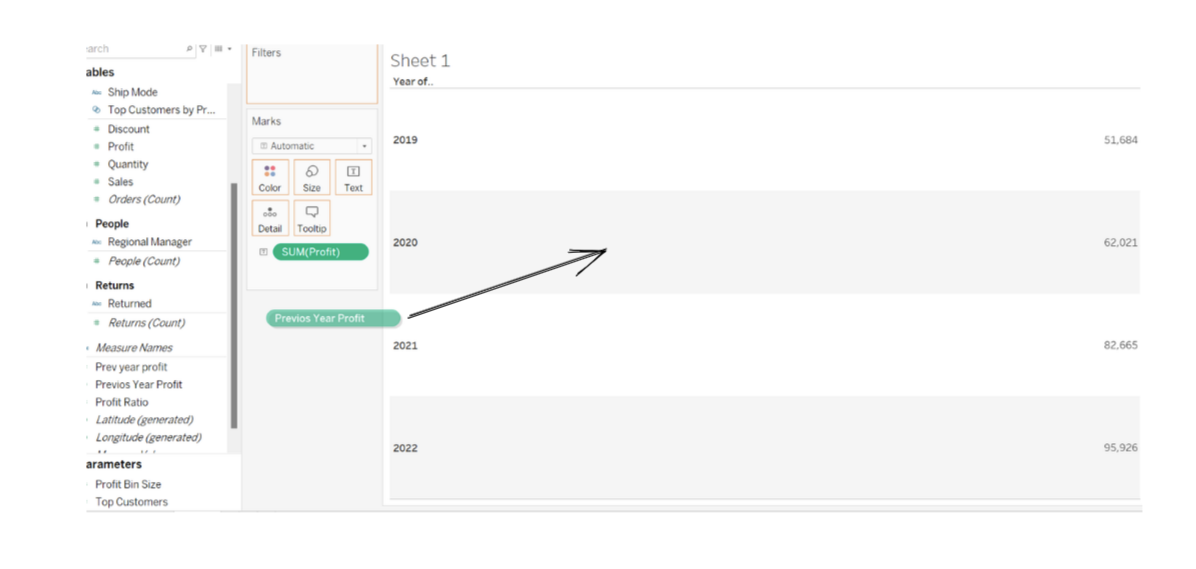
Step 3: Drag your calculation and compare
Step 4: Swap your value to order it the way you want to see.
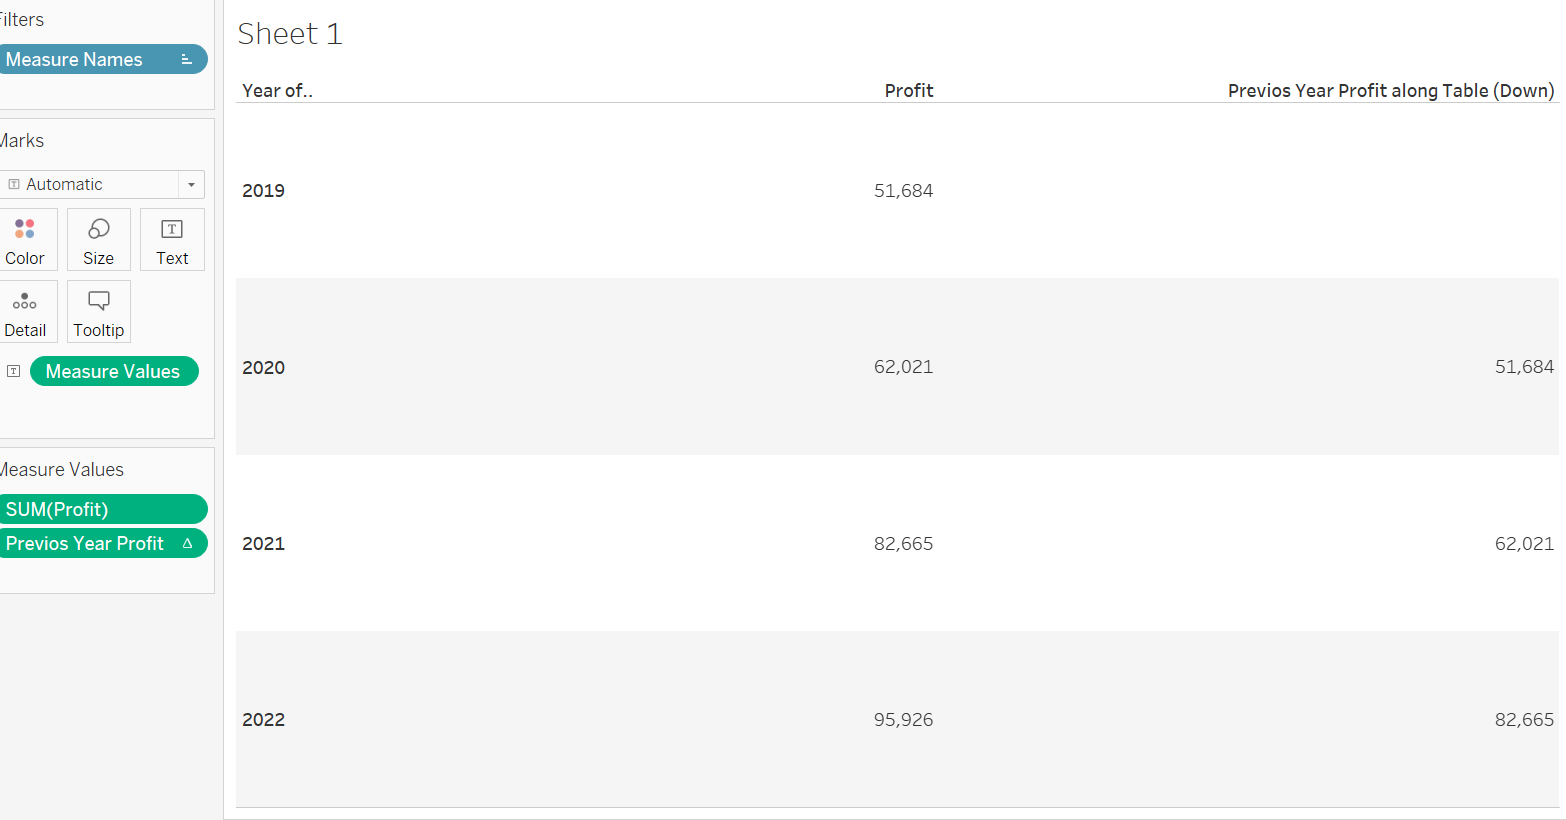
This take the values from previous years and allows you to then create a further calculation to compare your year on year growth.
Step 5:
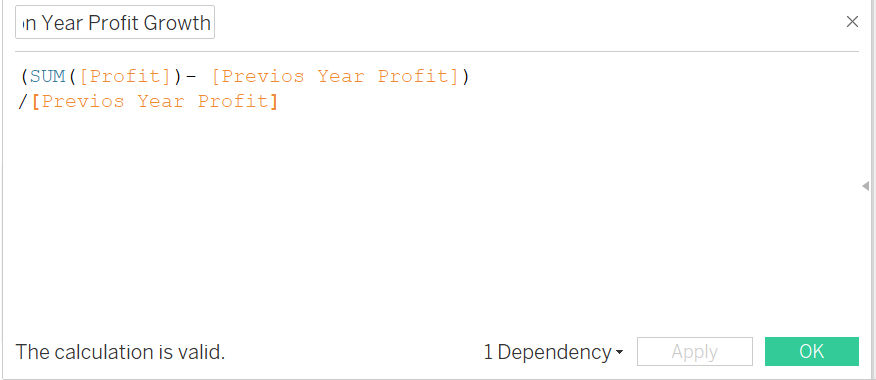
Step 6: Drag in your calc.
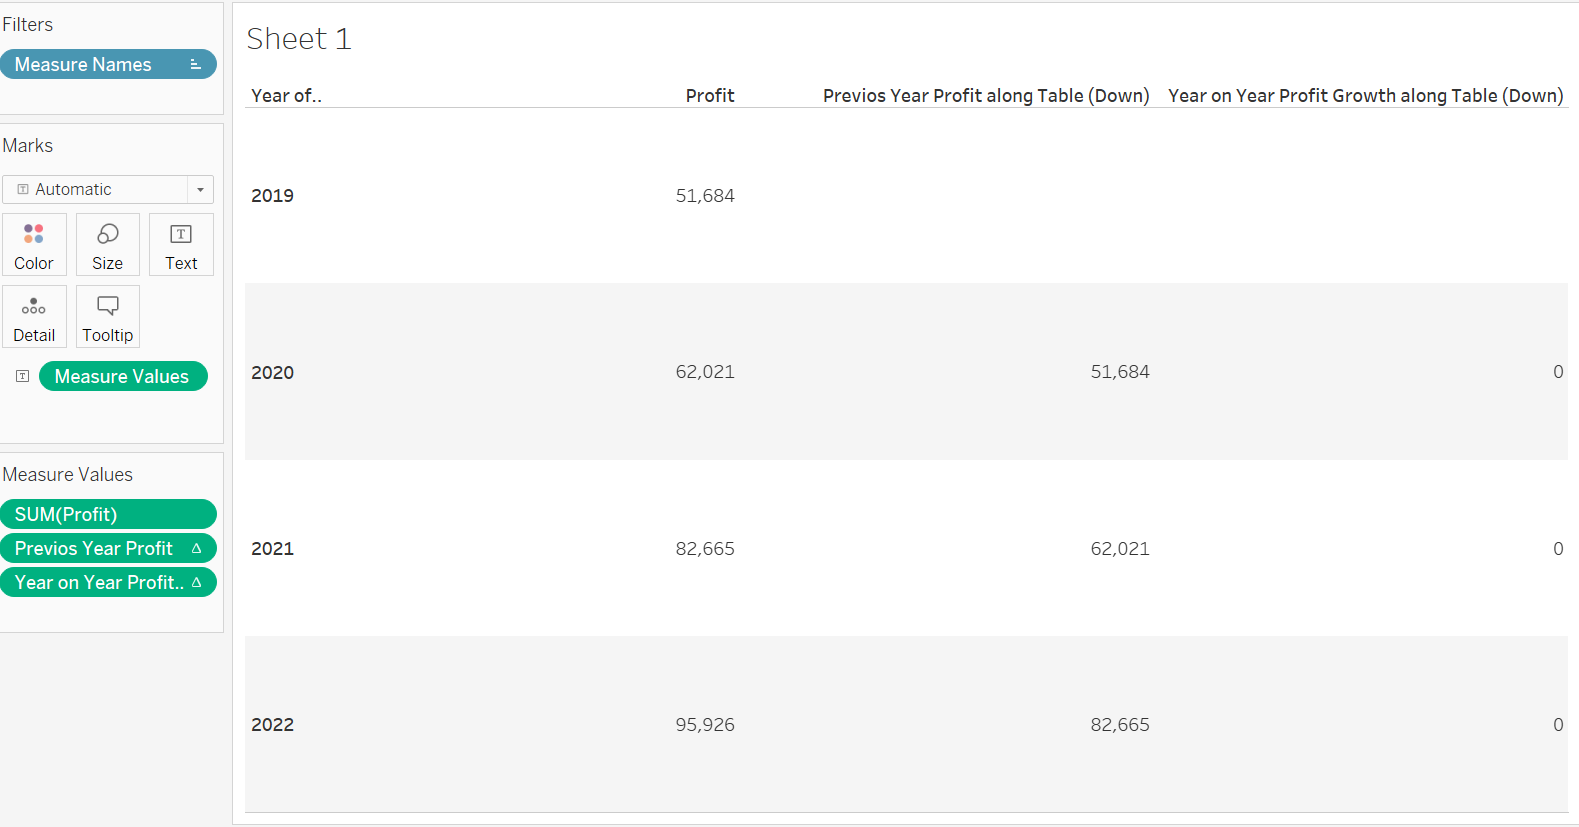
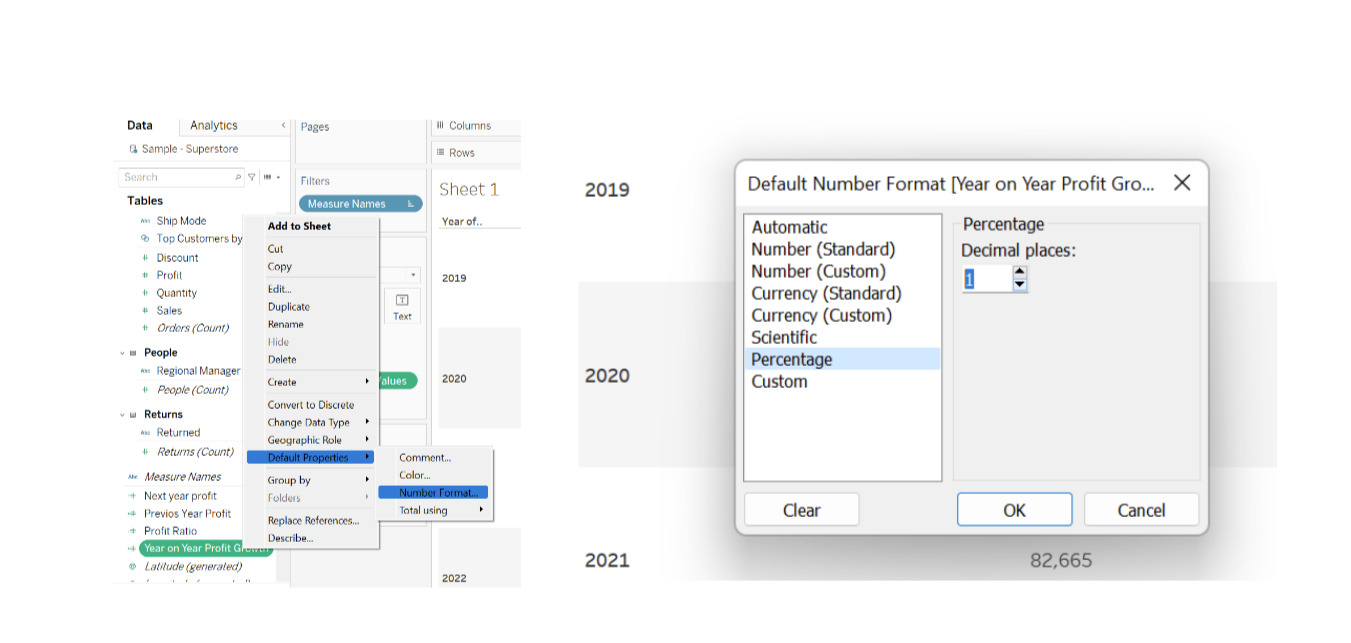
Step 7: Fix your formatting to show percentage
Final result:
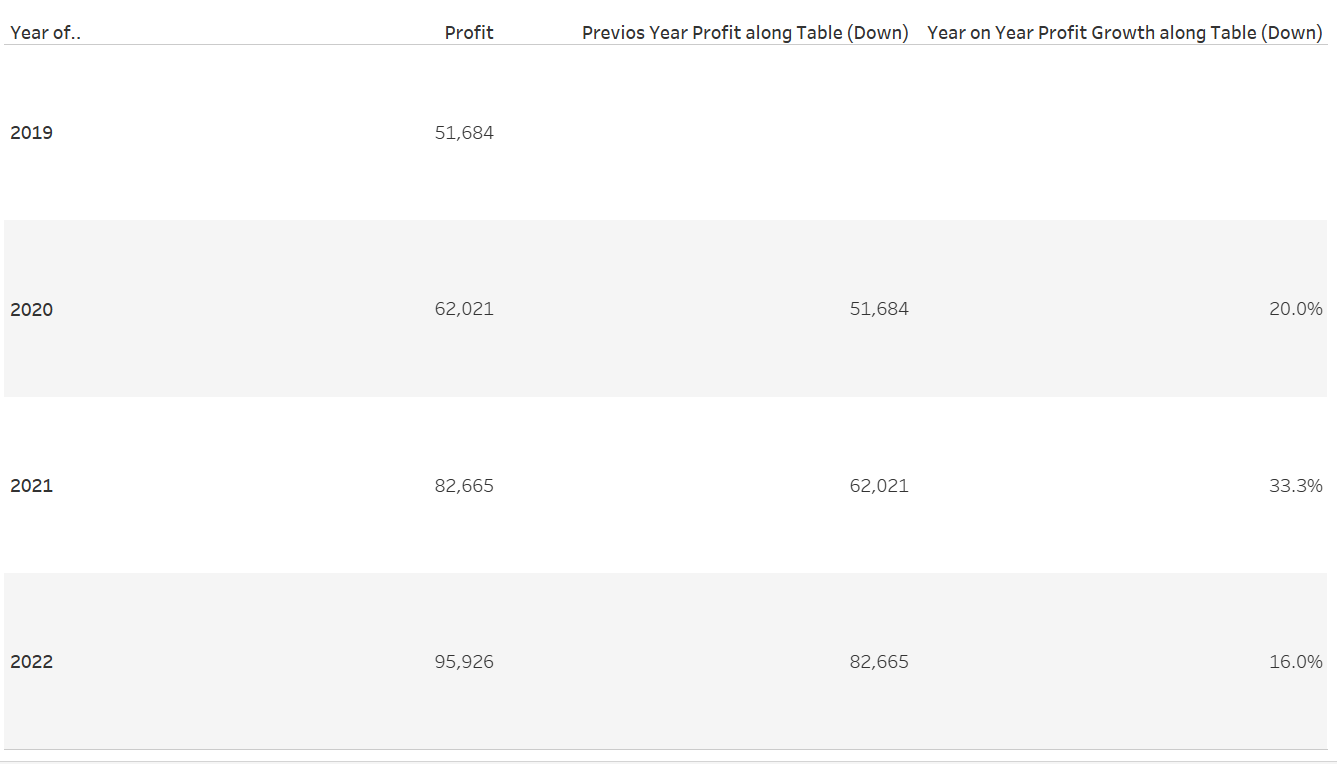
Now you have the percentage year on year growth relative to the last years profit.
Here's a link for a video with a demo of how to do this.
