


Data needs to be organized before being analyzed in Tableau. There should be just one distinct meaning for each column. When your data tables are too tall and narrow to be adequately analyzed, then you would need to pivot some rows of data to columns. This allows you to break things down. For example if one columns is named advertisement and contains three types of advertising avenues like television, magazine and radio, and another column contains the total spent. You would need to pivot that row of data to columns in this kind of scenario in order to assess the data as different metrics because pivoting your data allows you to create new fields to use in tableau desktop.
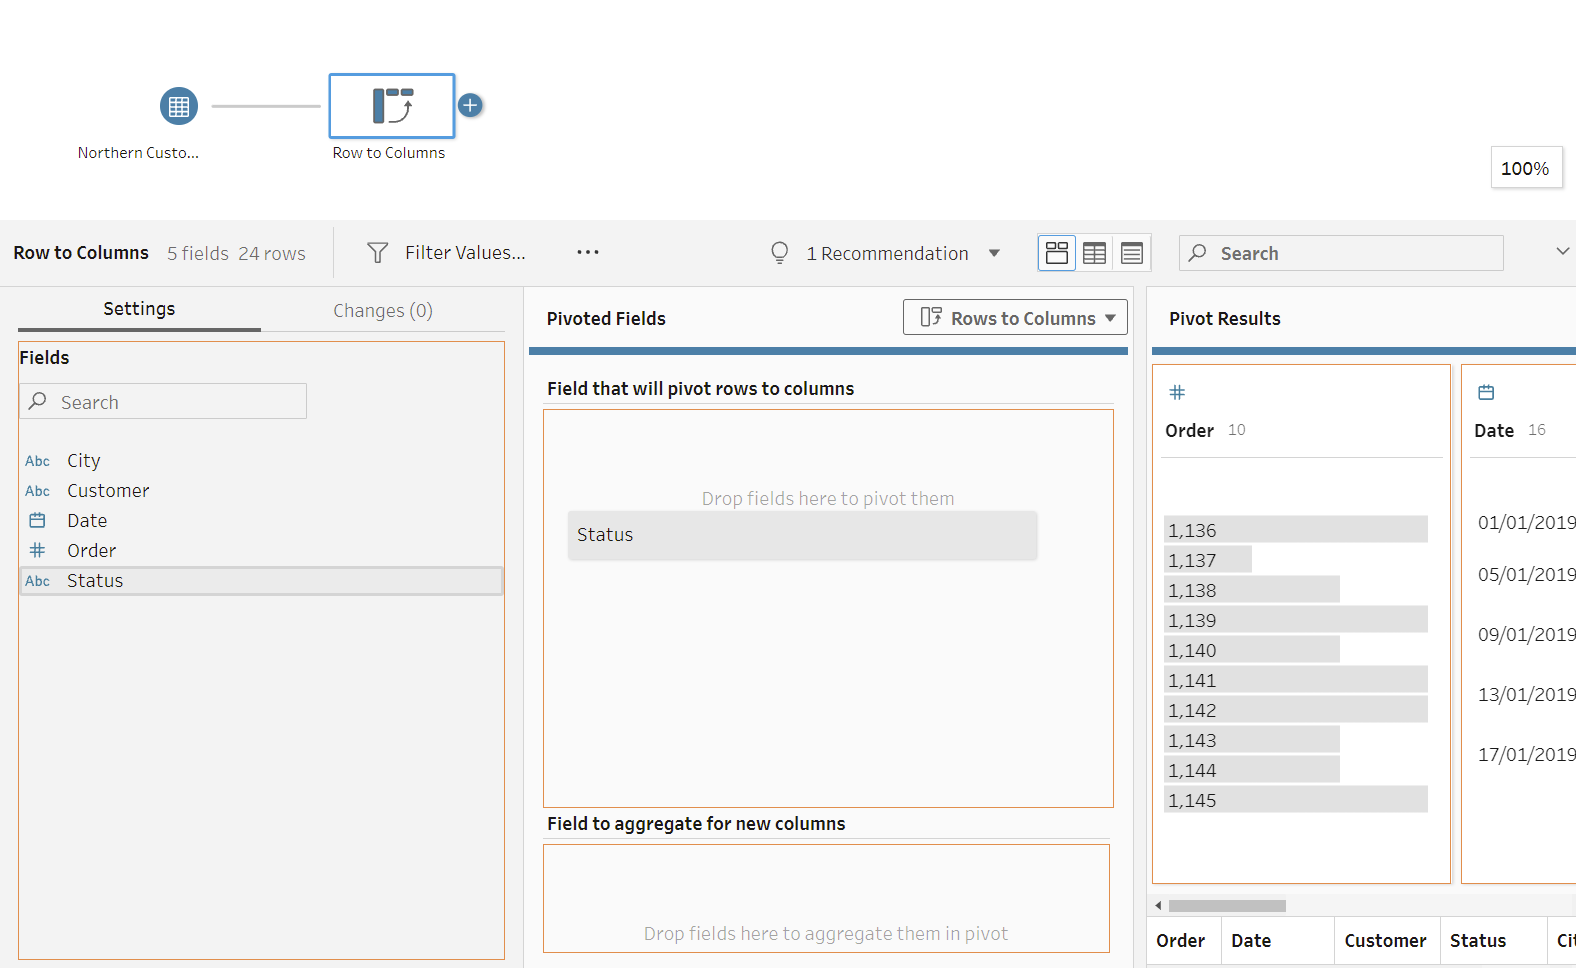
To begin pivoting your data, you would first need to know which fields you want to be your new headers and what fields you want acting as your values.
Step 1: Add the rows you want to be you columns.
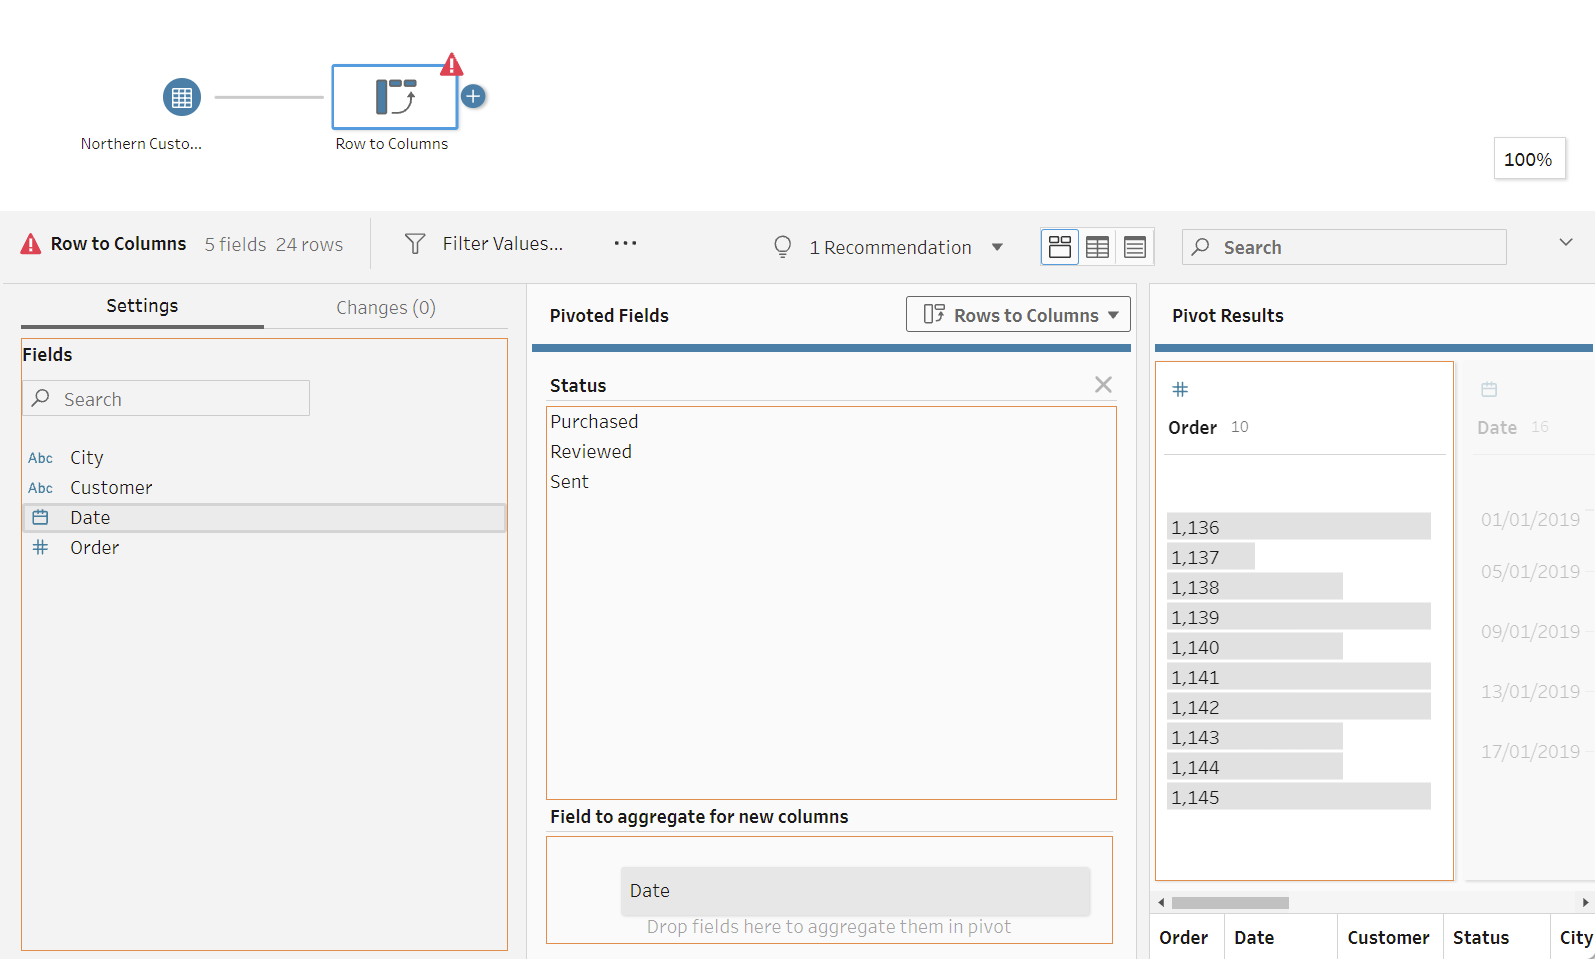
Step 2: You would need to add a field to act as your values within the new headers you create.
Step 3: Then double check your aggregations are the way you want them to show up or the way the should show up, so you aren't getting the same/wrong values throughout.
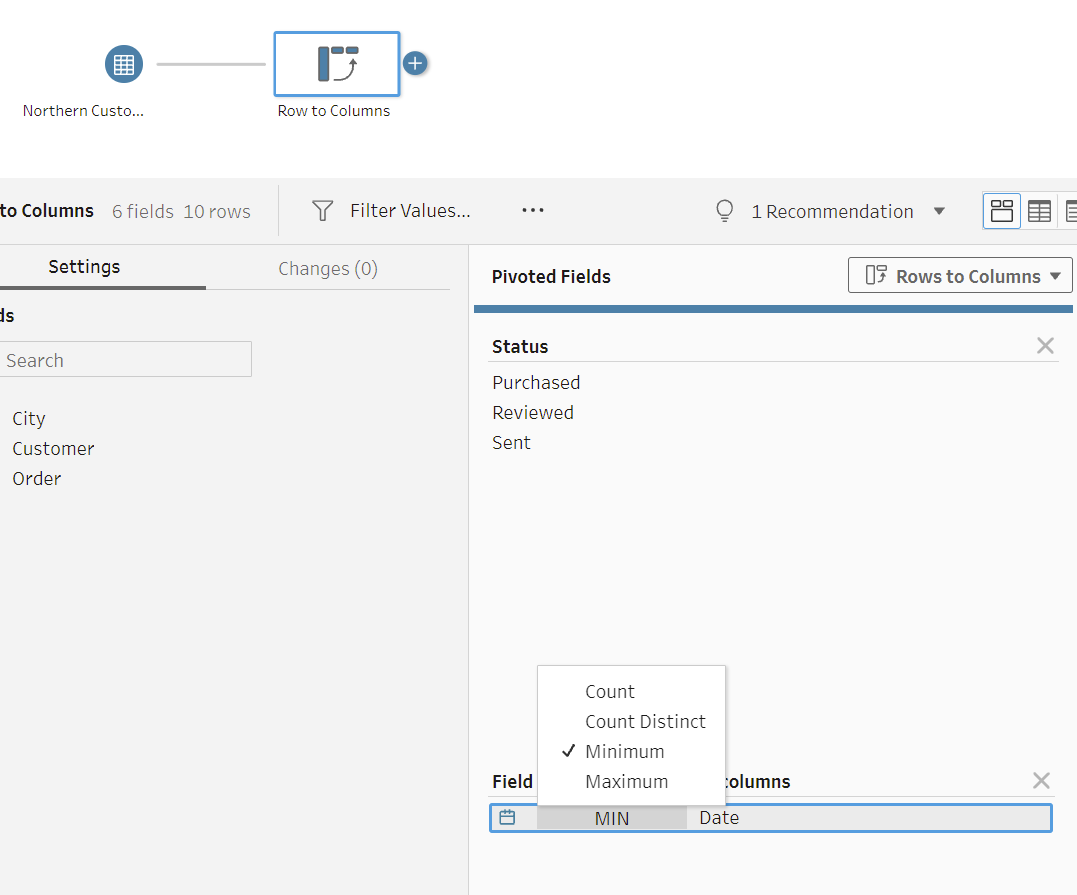
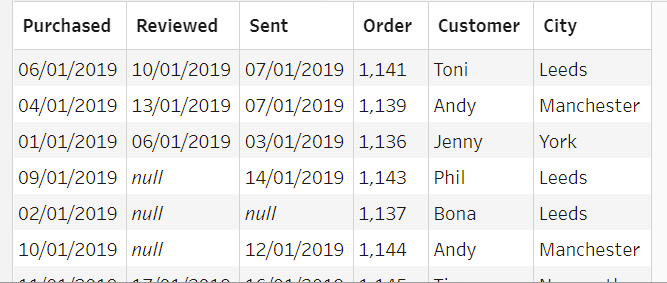
Both min and max would return real values because there's only one date associated with each status.
Finally:
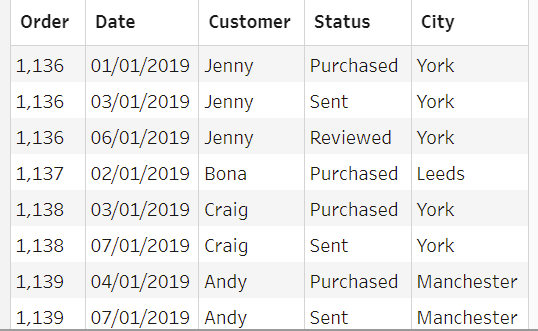
We went from having our data looking like this:
To this:
Allowing us to cross analyze between the statuses for each order.
Here's a video with a demo and how to create this.