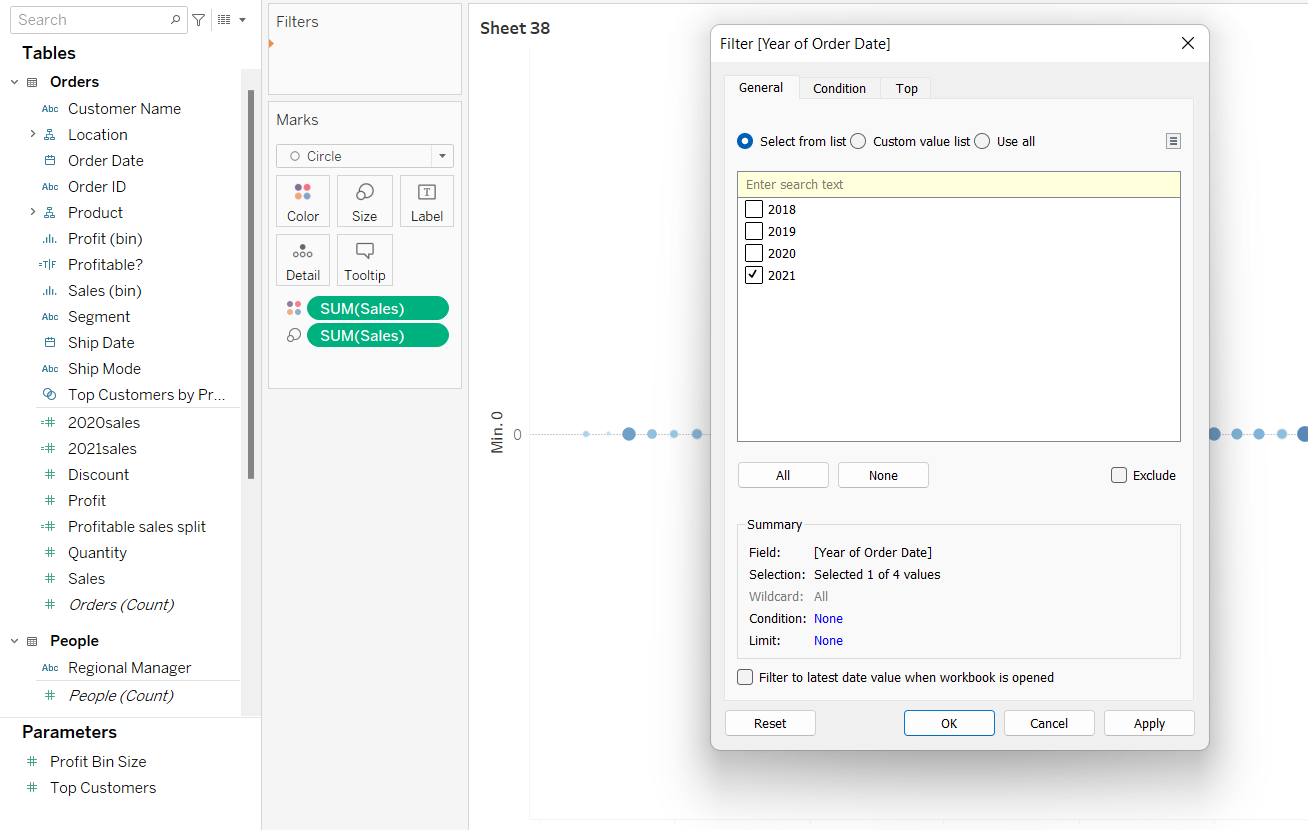
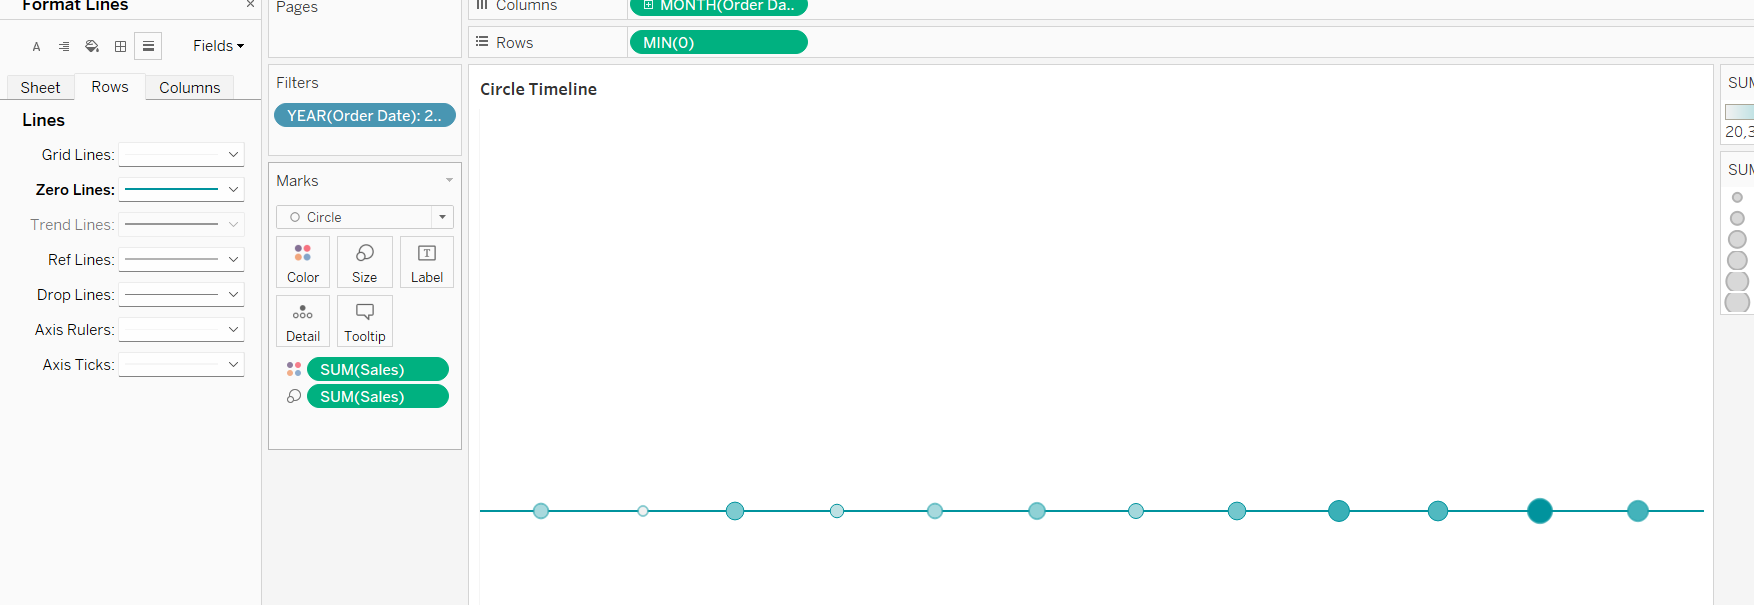
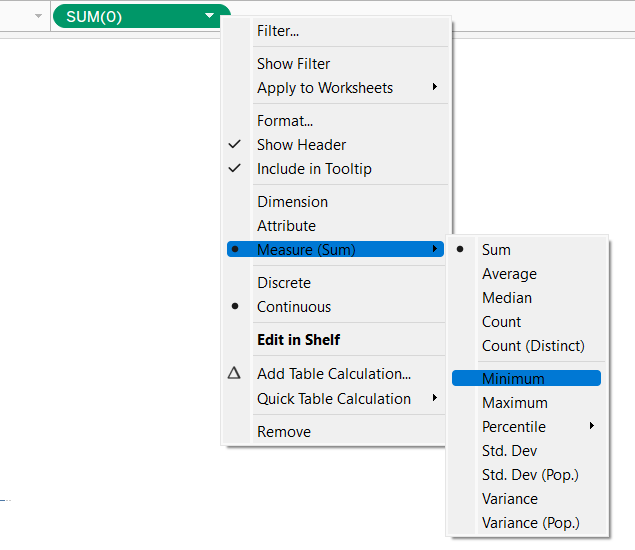
Step 1: create a 0 min line to get your time line

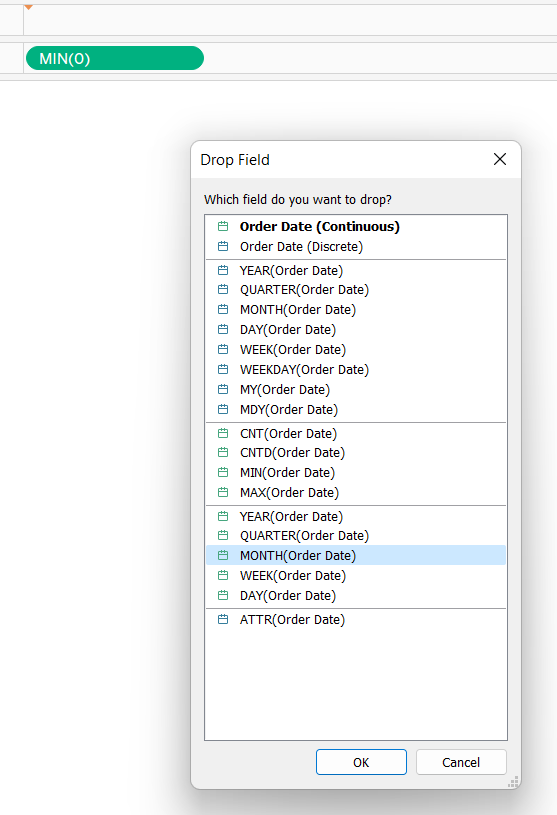
Step 2: Choose your date part and place it in columns
Step 3: turn your line into a circles and place the measure you desire to see over time
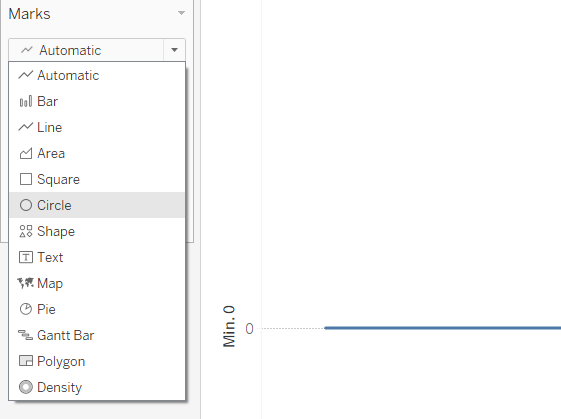

Step 4: filter for a year or any other date part of choice and format your zero line to be the colour of choice.
