


Dashboard Week began today with a challenge to find a dataset, remodel its structure, and publish as a Tableau Published Data Source. For this challenge, I took on the NYC Restaurant Inspections Violations data - quite a wide table, spanning 27 fields and 300k fields. The dataset shows every violation an active restaurant has had in the span of their time in business (it's updated daily to weed out restaurants that have gone out of business!). My main objective was to create a data model that would allow users to more seamlessly navigate their data.
How did I go about it?
Step 1: Define the user story: Who would use this data?
I came to two distinct conclusions:
1. Health Department Inspectors
A health department inspector would be interested in tracking the status of different restaurants across their area. Have a greater number of restaurants recently failed inspections? Are there any restaurants that repeatedly fail? Is there commonality in the violation codes in the area? These are all questions that are relevant to the role. Inspectors then have the authority to impose greater sanctions on those restaurants.
2. Restaurant Owners/Managers & Investors
Receiving health code violations and lower grades is a great concern to owners. Health inspection grades are directly linked to the business's reputation. A restaurant owner may filter down to their own restaurant and see the difference of inspection scores across time - have they improved? Have they gotten worse? This may impact their decisions around team training and policies. On the other hand, investors interested in funding restaurants may use this in their due-diligence to uncover facts about their potential investment.
Step 2: Identify different levels of granularities needed for different fields
Now that we know our users, we can separate our master table into various smaller ones depending on the level of granularity needed. The dataset is currently at the granularity of one violation per inspection per restaurant. Each inspection can have as many as 10 rows. This level of granularity isn't needed for every field.
Examples:
Grade: This is the grade given to a restaurant based on their results to an inspection. If this was at the violations level, the same grade would be repeated - it needed to be stored at the restaurant/inspection date level.
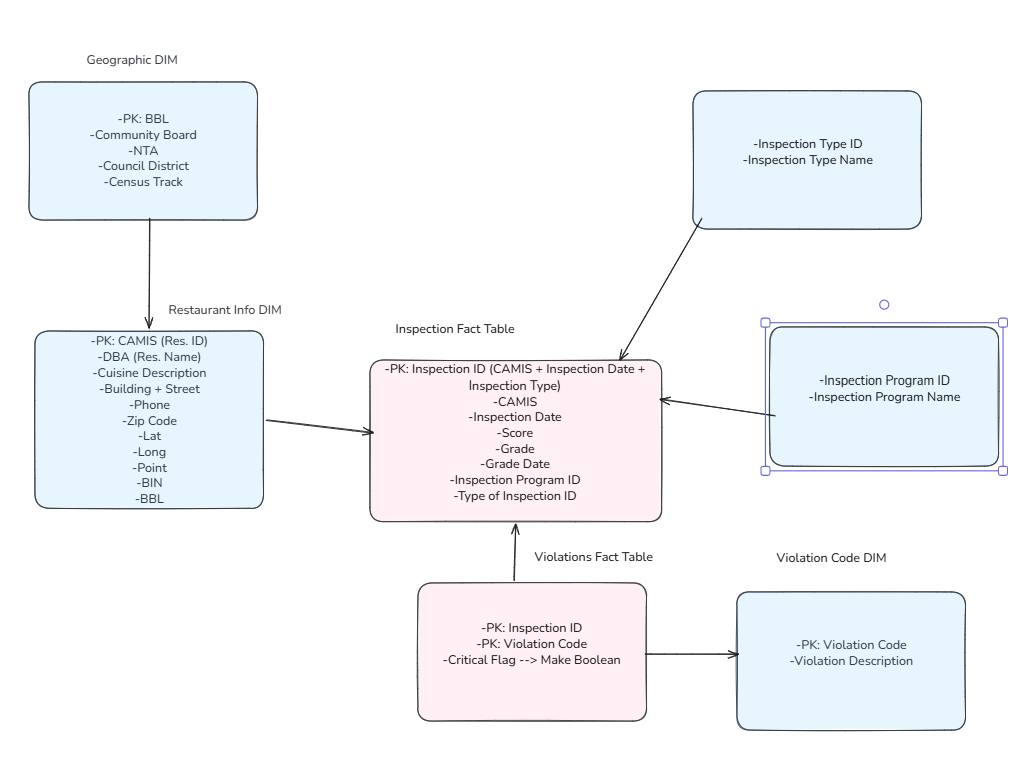
Community Board: There are not as many community boards as there are restaurants. If we stored the community board per restaurant, we'd end up with 50k rows repeating across 50 values. BBL is the NYC data unique identifier for Borough Block-Lots. Multiple restaurants will be in the same BBL. Using BBL as the primary key for a geographic table means the rows were reduced to 20k.
Step 3: Create the Schema
Pictured below.
Step 4: Create Relevant Fields
For example, currently no unique inspection id exists. I created one by concatenating several unique fields.

Step 5: Fully Input into Snowflake
After uploading a csv of the original file, I used SQL to create my seven mini-tables. Snippet of code below:

Step 6: Connect Snowflake to Tableau to upload to our Tableau Server
Lessons learned: your Tableau Desktop must always be in the same version as your Server in order for publishing to work! In this case, I had to install an earlier version of Tableau Desktop to create the data source.
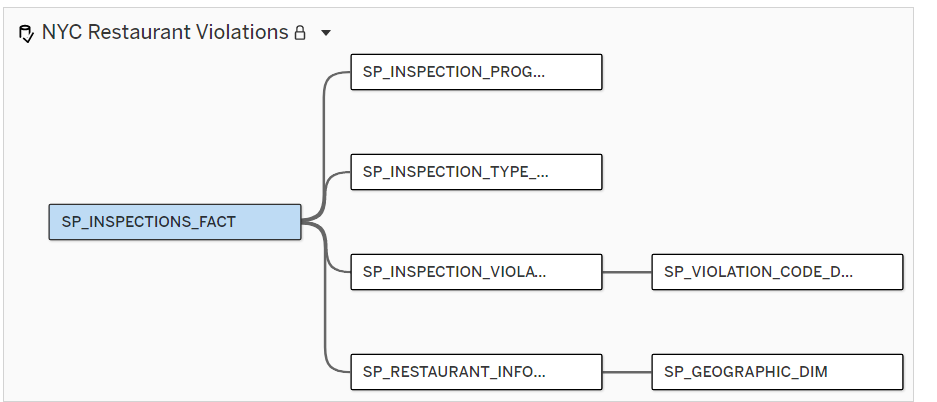
And vio-la!
By normalizing this 27-column flat file into a star-schema model, the biggest engineering win was solving the metric inflation problem: isolating inspection-level metrics like 'Score' and 'Grade' from line-item health violations ensures aggregates in Tableau remain 100% accurate without complex calculations. Additionally, normalizing heavy text strings into lookup tables and building a robust composite Inspection ID optimized Snowflake query performance, and prevented primary key collisions from same-day inspections, and cut down spatial redundancy by anchoring geographic data to NYC's unique BBL identifiers.
Ultimately, taking the time to restructure raw data before building visuals proves that great analytics start long before opening Tableau. By handling the complex grain shifts, primary key logic, and dimensional splits in Snowflake and pushing the final result as a Tableau Published Data Source, the ETL burden is completely removed from the end user—allowing health inspectors and restaurant owners to immediately drag, drop, and extract actionable insights with total confidence in their numbers.