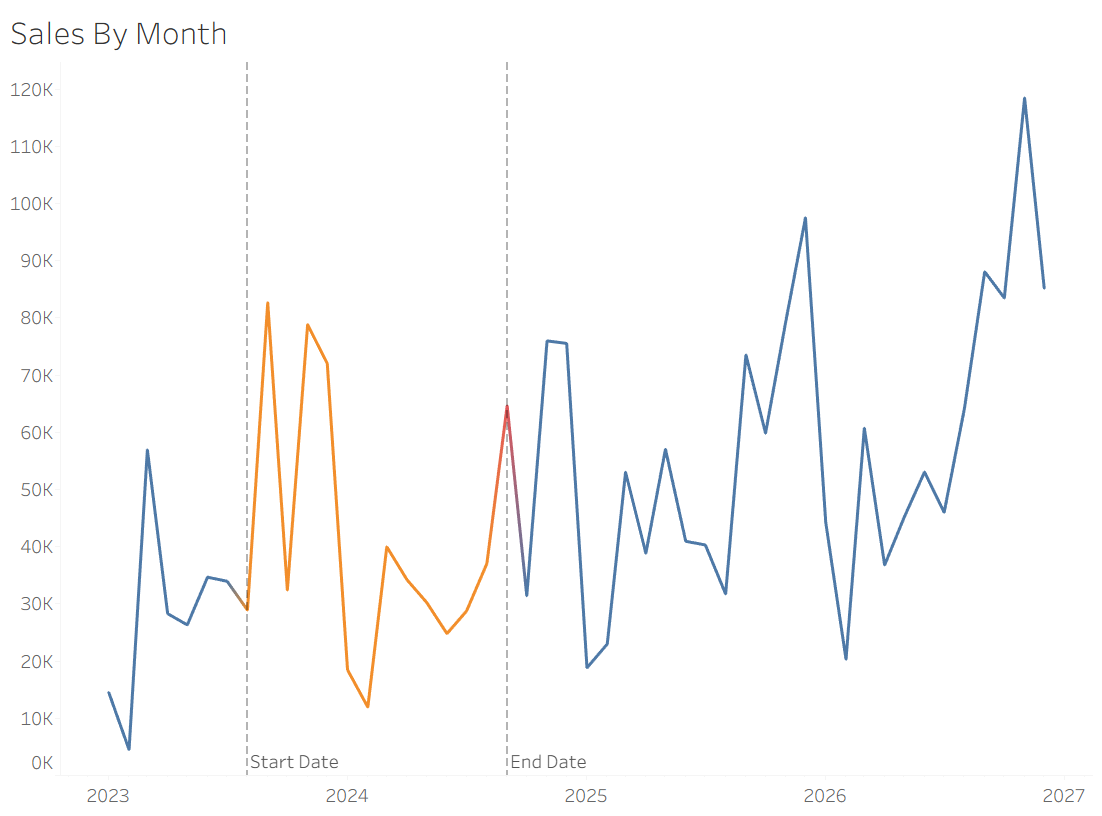
Say you have a line graph with a parameterized date range. You want the selected range to be a different color than the rest of the graph, but Tableau gives you something like this:
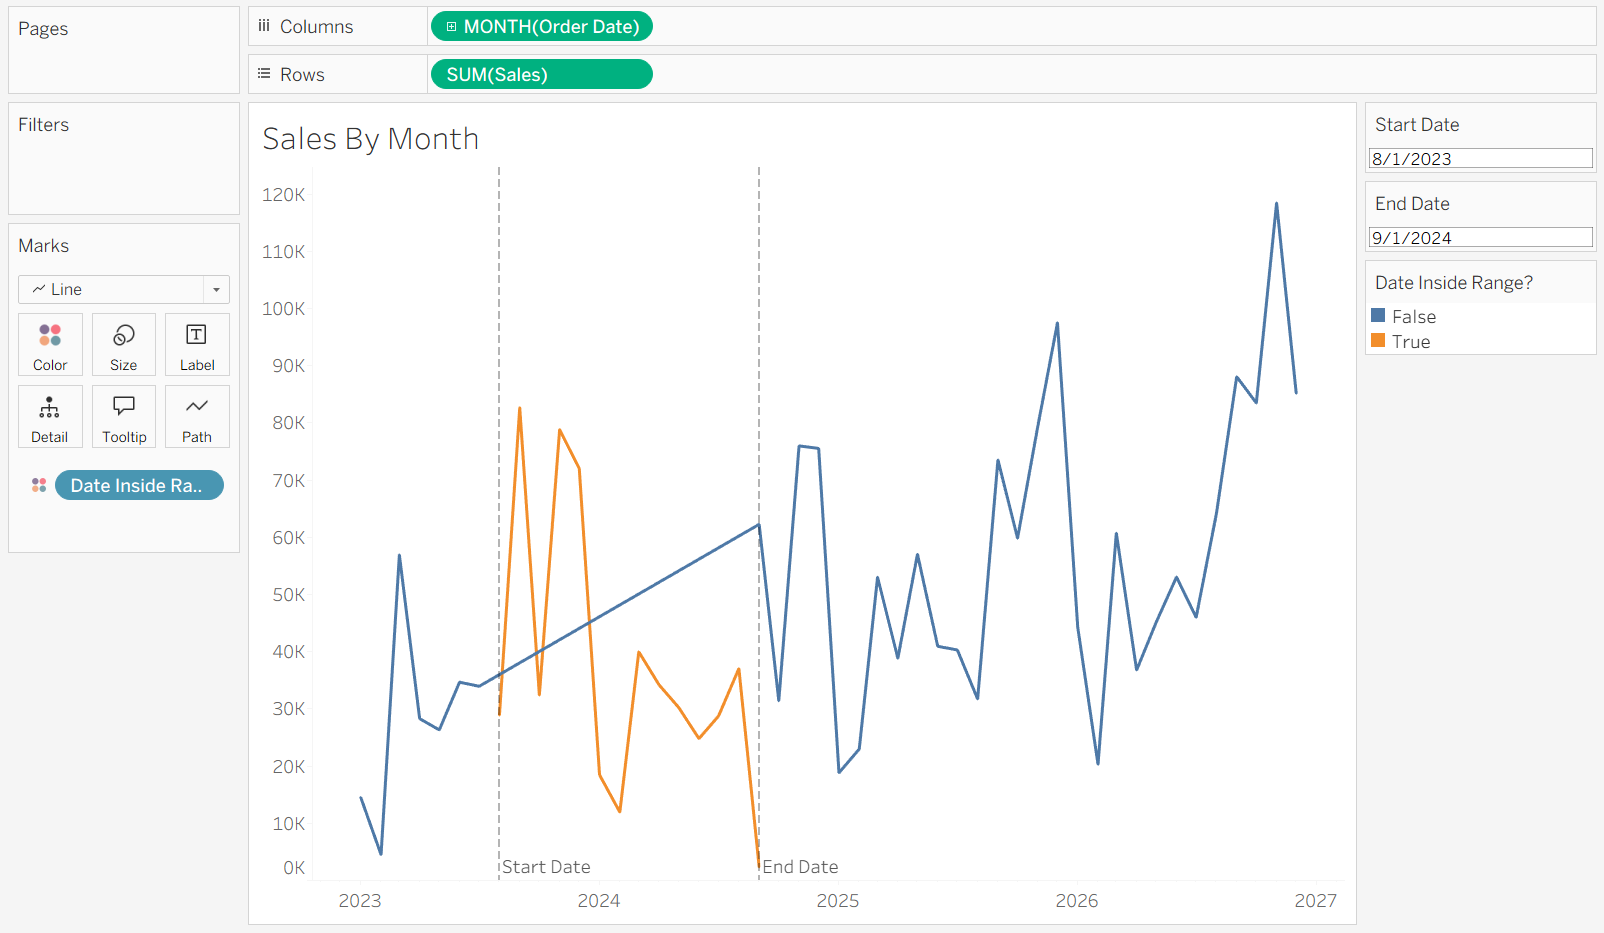
If you've ever been there, don't panic! The fix is quite simple. Assuming you already have a calculated field for the color (something along these lines):
[Order Date] >= [Start Date] AND [Order Date] <= [End Date]... all you need to do is change that calculation to an Attribute on your Marks card:
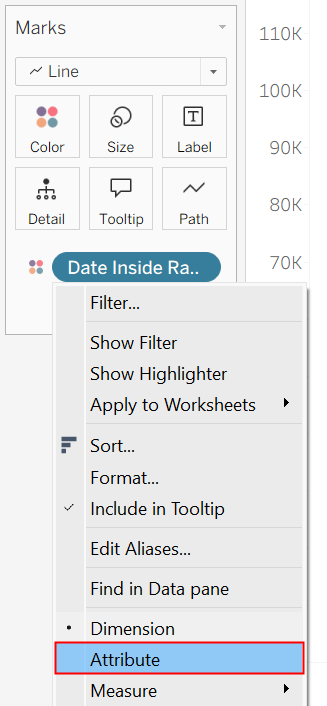
Now your line graph should be connected!