


Today, my cohort kicked off Dashboard Week strong... without a dashboard! Our task for Day 1 was to create a data model using a dataset of our choice. By the end of the day, we were to split our dataset into fact and dimension tables, load it into Snowflake, and publish it to Tableau Server. The goal was to gain practical insight into data engineering by implementing core backend processes.
Dataset
For my dataset, I decided to use Parking Violations Issued - Fiscal Year 2025, which is available on NYC Open Data. Since the full dataset has millions of rows, before exporting to CSV, I filtered to include data only between July 2025 and August 2026.
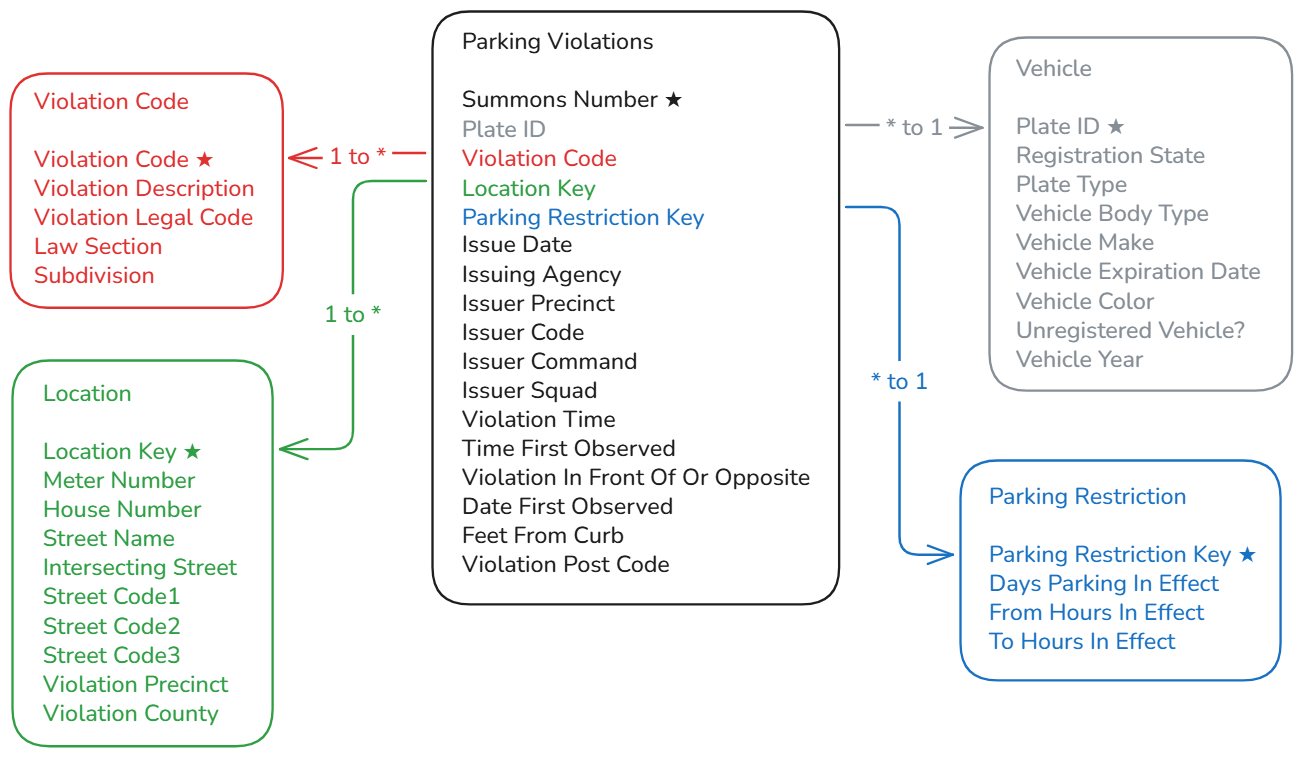
Sketch
The sketching process took longer than expected because I focused on grouping fields into their corresponding dimension tables. I did this for each field by asking myself the following:
- Is this field an attribute?
- If so, is it static?
If the field met both of those criteria, I would flag it as belonging to a dimension table. To my surprise, this required a decent amount of research on my part, such as learning the difference between fields tagged as "Issuer" versus those tagged as "Violation". If a field didn't meet these criteria, it belonged in the fact table. Thus, my schema became as follows:
Snowflake
After sketching my schema, it was time to input my data into Snowflake! But first, I had to define my fact and dimension tables with SQL. To begin, I started by defining a table for the raw data (sh_stage_parking_violations), where each column is defined as a string so as to avoid issues with automatic type conversions. After uploading the raw data into this table, I created my fact and dimension tables and inserted the corresponding data into them. For instance, this is how I defined the Violation Code dimension table:
create or replace table sh_dim_violation_code
(
    violation_code INT PRIMARY KEY,
    law_section INT,
    sub_division CHAR
);
... and this is how I inserted data into it:
INSERT INTO sh_dim_violation_code (
    violation_code,
    law_section,
    sub_division
)
SELECT DISTINCT
    TRY_CAST(violation_code AS INT) AS violation_code,
    TRY_CAST(law_section AS INT) AS law_section,
    SUBSTR(sub_division, 1, 1) AS sub_division
FROM sh_stage_parking_violations
WHERE TRY_CAST(violation_code AS INT) IS NOT NULL;
Throughout this process, I ran into a couple of fields that each consisted of a single value, so I ended up excluding some that were in my initial sketch. I repeated this for each of my tables.
Tableau Server
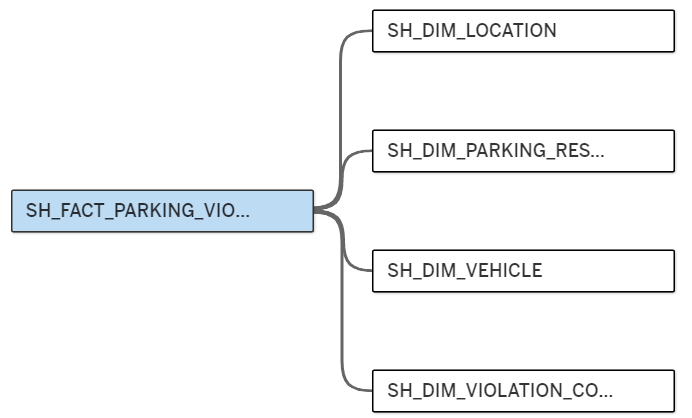
To publish into Tableau Server, I first needed to import my data into Tableau Desktop. I did so by downloading Snowflake ODBC 3.19.0 and using Tableau Desktop Version 2025.3 for compatibility. Then I dragged in my tables following the schema I had sketched earlier:
Lastly, I used Server > Publish Data Source to publish my data to Tableau Server!
Today's Takeaway
Since I worked with a lot of things I was unfamiliar with, my main takeaway from today was to not be afraid to ask for help. I'll definitely be carrying this into the rest of the week and into my rest of consulting career!